Beyond Maps

December 18, 2023

By Justin Hansen, Director of GIS Services, WSB

How GIS is Driving the Future of Data for Clients

As technology evolves, so does the way we harness information. Geographic Information Systems (GIS) have emerged as a transformative technology, empowering organizations with location intelligence. At WSB, GIS isn’t just about maps; it’s about turning geospatial data into a powerful asset that fuels innovation and smart decision-making for clients. The work we do with integrating GIS with other systems provides a dynamic data-driven insights and action. 

Foster Data-Driven Asset Management and Community Engagement 

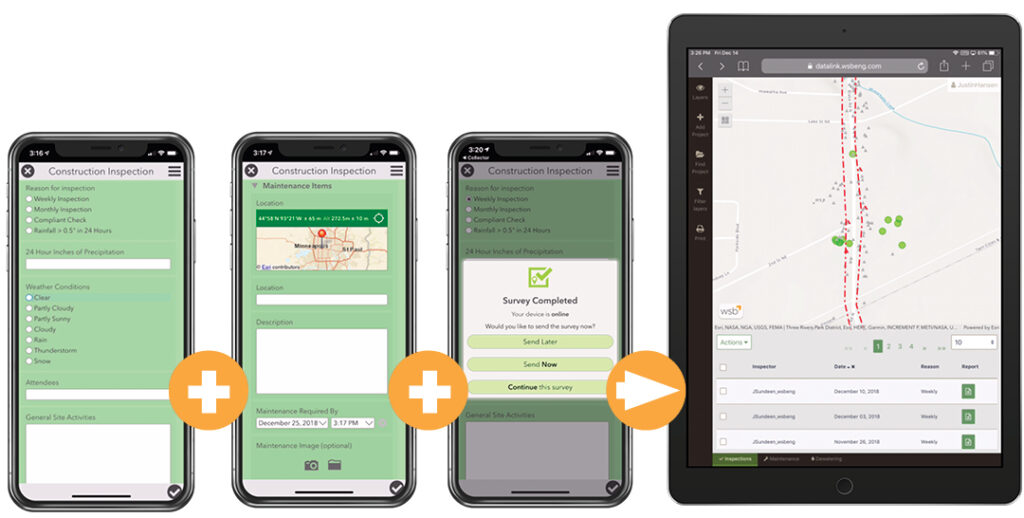
For government and municipal clients, GIS is a cornerstone technology. It doesn’t just create maps; it’s a system of record-enabling, efficient asset management. GIS is a system of engagement and can empower greater community insight. In Duluth, Minnesota we helped implement a GIS-driven app for citizens to report issues to the city like graffiti, downed signs or potholes. Appls like this bring maps, data and people together in real time.  

Drive Private Sector Solutions 

For commercial clients, GIS can help mitigate risk and drive informed decisions. For example, we collaborated with an insurance data analytics provider to infuse GIS into their products allowing them to offer a more cohesive approach to analyzing risk. GIS provides geospatial data-driven insights and predictive analytics that insurance carriers use to reduce risks and improve policyholder retention. This, in turn, empowers businesses to strategize effectively, minimizing potential losses and optimizing their operations. 

Enhance Safety and Prevent Damage 

Energy companies leverage GIS to enhance safety and prevent damage. These technologies provide location intelligence tools that can pinpoint potential risks and vulnerabilities with infrastructure and operations. This proactive approach enables energy companies to make informed decisions that protect their assets and improve operational customer safety. 

Support Multi-Dimensional Projects and the Future of Data 

As project operations become more complex and interconnected via technology, so do the dimensions of data. Our GIS solutions are future-ready, supporting integrations with Building Information Modeling (BIM) for 4D and 5D projects that add time-based and cost-based elements to the geospatial data. This advanced approach enriches decision-making and creates pathways for enhanced project data delivery, from complex urban planning to construction sequencing – offering a new level of insight. 

In the rapidly evolving landscape of data utilization, GIS is the compass guiding us toward smarter decisions, efficient operations and sustainable growth. We’re not just pioneers in integrating GIS across organizations; we’re partners in leveraging its power to shape the future of diverse industries. From the public sector to the private domain, GIS isn’t just about maps anymore – it’s about transforming data into a strategic advantage. 

Justin is the Director of GIS Services and leads WSB’s Geographic Information Systems (GIS) group. He has over 15 years of experience managing GIS projects, staff, software development, solutions design, systems integration, and GIS implementation. Justin works closely with our clients to implement GIS-based tools and systems that meet their needs, provide maximum value, and foster engagement.

[email protected] | 763.231.4846

Unlocking the Power of GIS for Small and Midsize Cities

November 13, 2023
By Bryan Pittman, GIS Lead, WSB

Geographic Information Systems, or GIS, have become indispensable tools for cities of all sizes in their quest for efficient data management, smart decision-making and improved civic engagement. GIS is a technology that allows for the capture, storage, analysis and presentation of spatial data. This system combines geographic information with other forms of data, offering a unique perspective on various aspects of a city. Insights from GIS can drive sustainability outcomes, advancing economic, social and environmental benefits, as well as many other benefits that help advance city goals.

Today, many communities are sitting on a vast amount of data, but unsure how to aggregate and access it all in one place. These communities tend to also have the software tools and licensing necessary to use this data in the correct manner, namely Esri’s ArcGIS Online. These communities then already have all the data and tools they need to be successful with their GIS data, they just need assistance in putting the pieces together. WSB recently worked with two cities in Minnesota – Hastings and Saint Michael – to audit and organize their data, ensuring they were able to unlock its full potential.

What Kind of Data are Cities Collecting?

Small to midsize cities stand to gain significantly by harnessing the power of GIS. When thinking about how to best utilize data, it’s important to understand what data is available. GIS data communities are collecting, include:

  • Public Utility Data: Efficiently managing utilities data, including sewer, water and gas pipelines is critical. GIS data can help cities maintain these systems effectively, while minimizing disruptions and enhancing public service.
  • Community Development Data: Understanding land use and zoning is crucial for urban planning. With GIS, cities can optimize land use, improving infrastructure and the allocation of resources.
  • City-Created Data: Cities can aggregate data for specific needs and uses. Collecting and analyzing data related to city services, demographics and infrastructure can lead to smarter decisions and resource allocation. Moreover, cities can extend the benefits of GIS to the community by increasing data accessibility and conducting community outreach. For instance, some cities are surveying residents to compile data on doorbell cameras which can help law enforcement solve crimes.

Who is Using the Data?

Just as important as understanding what data is available, it’s important to understand who should have access to the data. Public works and engineering staff should have access for maintenance, repairs, planning and asset management. Community development teams can utilize data to create story maps. And ultimately, a case can be made for every city department to have access to data in some form to help drive collaboration, communication and a shared understanding of city priorities.

Where Should Cities Start?

When WSB worked with Hasting and Saint Michael to organize data, this is how we effectively gathered and aggregated their data into one platform.

  1. Perform a data and software review. What programs are being used and does the city need additional licenses? Doing an audit of this information is a good place to start.
  2. Prepare data for ArcGIS Online. Standardizing the data across platforms ensures that when it is all moved to be housed within one program, data is understandable, accessible and usable.
  3. Publish all data to ArcGIS Online. Once the data is standardized, all information is uploaded to ArcGIS Online, Esri’s cloud infrastructure.
  4. Create web applications and web maps. Now that data is all in one place, creating applications is important so users can access the data they need. Not all licensed users will need access to every bit of information. Applications make the data more usable and ensures that if data is updated by one user, it is reflected across the cloud.
  5. Train staff to understand the program and use the applications. Data is only useful if it’s understandable. WSB works with cities to train staff on how to access, update and utilize data within the cloud and related applications.

When it comes to GIS services, WSB is the ideal partner for small to midsize cities. WSB offers the expertise of a team with decades of experience in GIS and related services, guaranteeing that your city’s data is in capable hands. Furthermore, WSB’s commitment to direct municipal collaboration means that they thoroughly work to understand the unique challenges and opportunities that cities face, ensuring that GIS solutions are tailored precisely to your specific needs.

What every community should know about asset management

Bart Fischer, Senior Public Administrator, WSB

Bart Fischer, Senior Public Administrator, discusses how asset management can lead to better decision making with WSB’s Director of GIS Services Justin Hansen.

Asset management is incredibly important, but not often valued to its full potential. Gathering data is great, but only if that data is used effectively.

I recently sat down with WSB’s Director of GIS Services, Justin Hansen to learn more about Asset Management to get his perspective on how communities can use it to their advantage.

BF: Asset management is a big topic – I often find it overwhelming. What is the main thing a community should understand about asset management and GIS?

JH: Asset management is incredibly undervalued. Solid asset management can lead to more informed decision-making, proactive and practical planning, improved capital planning decisions and better resource management.

BF: What is one of the most common issues you see when it comes to asset management within a city?

JH: I think asset management is misunderstood by some communities. Many cities will go out and purchase a system, but they struggle to realize the benefits of it. The system becomes something that is just being used for data input and nothing of true value. It may be assisting a city with their day-to-day support of operations, but they’re not using it to its full potential as an organizational-wide decision support platform.

BF: What is the solution to that problem?

JH: Education and planning. Take the time to educate key staff about asset management and how it can be applied to your city. Include staff across the city; not just public works and engineering. Develop an asset management strategy and plan for implementation. This helps develop organizational goals and allows the city to make a more educated decision on how to proceed with asset management.

Some communities may only need to start with a GIS-centric asset management approach where they utilize tools like WSB’s Datafi. Datafi gives cities an easy-to-use tool to manage field operations using GIS. Datafi can help change the culture at a city to understand the benefits of using technology in the field to assist with operations. Other communities will want to invest in full-blown asset management systems that meet their needs for approaches to asset management, operations and planning.

BF: How does streamlining asset management benefit a city?

Cities have an immense challenge around how they operate efficiently and effectively. Balancing the needs of residents, planning for future infrastructure improvements and preparing for the unexpected are benefits that come from a strong approach to asset management. Data gives staff ammunition to back-up a decision or a recommendation. It provides transparency and helps align priorities. 

BF: How have you seen cities be successful with Asset Management?

JH: Cities that have been successful with asset management have always built a culture that embraces using technology to manage operations. It’s hard to think outside of the status quo when you’re driving forward fast and furiously but investing in these systems now will better prepare communities for the future. Also, successful communities get engaged and communicate the impact that asset management has on their organization to their residents while also providing ways for their residents to participate through citizen request applications.

There’s been a lot of chatter about Smart Cities and Smart Communities recently, but what I find the most interesting is that many communities are already smart. They’re using GIS and asset management to make data-driven decisions. Leveraging data to make informed decisions is the core tenant of a smart community. Don’t be afraid to embrace it!

Bart Fischer has over two decades of experience in public administration. Throughout his tenure, he’s worked in five Minnesota communities as the city or assistant city administrator.  Bart joined our firm in 2019 as a senior public administrator and focuses on lending his public service expertise to our clients.

[email protected] | 651.286.8484

Justin Hansen has over 13 years of experience in managing GIS projects, staff, software development, solutions design, integration and implementation. Justin works closely with clients to implement GIS-based tools and related systems that maximize value and foster engagement.

[email protected] | 763.231.4846

The future of Utility GIS: Understanding the Utility Network

By Alex Johnson, GIS Solution Architect, WSB

Organizations have been using GIS to manage utility assets for years. Historically, GIS has been utilized as a system-of-record for mapping and asset management within organizations tasked with managing utilities, pipeline and telecommunications. It’s not only important to know the where and what of your utility assets, but also their condition and how they relate to each other.

GIS has evolved into a system of engagement that creates easy access to your organization’s data and the ability to integrate it with asset management systems through the web. This provides organizations systems for recording that encourages easy access to data and data sharing. As GIS continuously advances, so does its ability to manage your utility infrastructure. The release of ESRI’s Utility Network provides a new fundamental approach to utility management; a smarter, faster, and more accurate way model your system.

The Utility Network gives organizations a full platform to manage their system that is based on industries like water, electric and natural gas. ESRI has created data models that simplify the data structure and provide a foundational platform for companies to start with.

These data models will:

  • Organize utility information into a cleaner and better structured database.
  • Provide a solid foundation and allow for customization to better meet the needs of each organization.
  • Give users a streamlined editing experience that extends beyond normal desktop applications and into mobile and web applications.

Quality data entry is key when editing an organization’s GIS database. The Utility Network focuses on data quality through enforcement of industry standard rules and allows organizations to set requirements for how data is entered and edited. These requirements are fully customizable to meet the needs of each individual client and give more control over data ensuring that quality information is being entered.

In addition to new data models, the Utility Network offers new features and functionality. Users can now view and interact with data in ways that resembles reality including new data concepts such as assemblies, containers, and associations. In earlier systems, GIS assets had to be snapped on top of each other to enforce connectivity. Now, assets can be spread apart and shown in a more logical and easier-to-view way while maintaining connectivity. These new formats allow building a GIS system that is more flexible, connected, and easier to understand.

Performing analysis of utility systems is nothing new to organizations, but with the Utility Network it has been greatly expanded. New tracing tools allow for more specific analysis; users can experience greater understanding of how their system works and improve decision making. These tools were built for the ArcGIS Pro environment, users can expect quicker responsiveness and greater data processing capabilities.

Preparedness is an important step to getting ready to migrate to the Utility Network.

  • It’s about more than simply preparing the data but ensuring the appropriate system architecture in place to allow for a smooth transition.
  • Confirm the existing GIS systems will accept these new data formats.
  • Become familiar with ArcGIS Pro, this new system was built specifically for it.

Since this is ESRI’s model for the next 15+ years it is important to start preparing now, proceeding with care will help ensure a successful transition. Navigating to the new Utility Network does not have to be a daunting process. Experts at WSB help by creating road maps to facilitate the smoothest possible transition into the future of utility management.

Alex Johnson is a GIS professional specializing in the ESRI’s ArcGIS Platform, database management, ESRI’s Collector & Survey123, and administrating web and feature services. He has created web mapping applications, developed database schemas for utilities, and converted numerous data formats into GIS for utilities and local government.

[email protected] | 651.380.7042

How to leverage technology and streamline environmental compliance inspection

By Zach Kolsum, Environmental Compliance Specialist, WSB

Conducting inspections on infrastructure projects can be daunting, especially when they require extensive reporting and legwork to comply with local, state and federal regulations. Fortunately, there are technological tools available to assist environmental compliance and construction inspection, which streamline the arduous process of data collection and reporting for clients. Using standardized software, WSB provides the necessary equipment and materials to conduct a variety of inspections, enhanced reporting and automated data collection.

Enhanced reporting

Electronic inspections offer an effective way for teams to visualize the work being done onsite. Data is collected and compiledusing a software application to generate a list of report leads. Project partners can share critical information instantly using the visual media tool.

Share project information quickly

Depending on the project, problems that arise during inspection can be costly and take valuable time away from clients and shareholders as they work to find a solution. WSB provides automated reporting and digital photo sharing with the click of a button to the entire project team. Reporting is tracked through an online database and clients can save documents and project findings in the application archive. Sharing project reporting instantly between team members is an easy way to monitor and ensure work is progressing on schedule.

Manage your data

Leveraging the use of mobile devices for inspection improves the effectiveness of field data collection by integrating mapping and field technologies into a single workflow. This methodology also minimizes the possibility of human error which increases the quality of data overall. Collected information is analyzed using a powerful search engine that identifies trends and future forecasting.

Use Datafi for Environmental Compliance inspection

WSB’s Environmental Compliance and GIS groups worked together to develop Datafi, a mobile-friendly mapping and workflow tool to improve the environmental compliance inspection process. Datafi is a field-to-office data management solution that has allowed multiple groups within WSB to actively and efficiently inspect numerous project sites to ensure compliance. Datafi is used on small and large-scale projects including housing and land developments. Our team of inspectors have benefited from Datafi’s enhanced reporting, efficiency and improved data management in the field.

As tedious as documentation management may feel at times, it is an essential part of any program development. Discovering new ways to refine processes is paramount for keeping information as reliable and accessible as possible. We believe utilizing technology allows project teams to focus more heavily on the technical aspects of the work and bringing their client’s vision to life.

Zach is an Environmental Compliance Specialist dedicated to improving his community. He has a strong understanding of federal and state regulations, providing technical, administrative, and operational support for a variety of clients concerning NPDES regulations (MS4, construction, industrial permitting) and compliance with the Clean Water Act. Zach is committed to improving his community through environmental and conservation services, including soil erosion and stormwater management.

[email protected] / 612.201.6809

Optimize your data

By Justin Hansen, Director of GIS Services, WSB

As the world continues to evolve through the advancement of technology, new opportunities and challenges arise that you may, or may not, know the best way to tackle. Staying abreast of new systems and solutions can be a daunting, even overwhelming, task.

At WSB, we use Geographic Information Systems (GIS) to improve the way organizations acquire, understand and use their data. A successful GIS program employs geospatial technology to improve the quality of services, positively impact the decision-making of a community, become a central location for all data and improve overall workflow. To help simplify it for you, we will share some of the most common issues that we encounter and provide some advice on how to handle them.

Unable to retrieve data quickly enough

A properly designed and managed GIS will allow you access to all your organizations information at the touch of a button. Through field to office integration software, your team can enter field data directly from the site of the work and make the data immediately available to you. If you need to be able to verify a critical utility repair in order to calm concerned residents, your team can document the nature of the problem, how and when it was repaired, and include supporting photos or documents.

Unable to locate needed documents

It is time to go paperless. There is no need to continue to store paper documents in your office. They take up unnecessary space, get disorganized and go missing. Have you ever needed to find an as-built in order to verify the location of utility lines and been unable to find the final version? Using a GIS will allow you to convert all your supporting documents into digital files, tag them to any relevant accounts or locations for easy retrieval, and support a greener way of conducting business.

My data is outdated

Using ledgers and spreadsheets to manage your data quickly becomes tedious, time consuming and inefficient. If your system for tracking data involves any of these methods, it is likely current data has not been entered more than once. Imagine you need to share results of a lift station’s most recent inspection, but the most current document you can find is 3 years old. This could create a serious problem if you are unable to provide accurate findings. To ensure your group is working with the most accurate data available, a GIS is an easy and organized way to allow anyone the ability to enter information, keep it all stored in one central location, and control access to sensitive data.

My team is not able to work together efficiently

Do you have people working from more than one location? Do you often find you are emailing the same spreadsheet to multiple people to add data? There must be a more efficient way for your team to work together, right? A GIS can allow everyone on your team the ability to access, edit, and report from your groups database without wondering which version is the most up to date. It can save you time and frustration, allowing your group to spend their valuable time on other projects.

Our GIS group has worked with many clients to find solutions to their data problems. If you find yourself wondering if there might be a better way, please contact us. We will help to determine which of our complimentary, introductory services can improve how your organization works.

Justin leads the GIS Solutions Team. He is an accomplished Solutions Architect with a broad subject matter and technical experience in enterprise GIS and asset management technology. Justin has over 12 years of experience in the GIS field and holds a Master of Geographic Information Science degree from the University of Minnesota.

Light Detection and Ranging (LiDAR) Elevation Data

Bryan Pittman, Sr. GIS Specialist, WSB

What is LiDAR?

LiDAR, which stands for Light Detection and Ranging, is a combination of “light” and “radar.” It’s a remote sensing technology that uses lasers to detect and measure features on the surface of the Earth. Due to its high accuracy, LiDAR has become the de facto standard for creating elevation surfaces and measuring heights of features above the ground such as trees or buildings.

LiDAR in action

Minnesota completed a statewide LiDAR gathering project funded by the Clean Water, Land and Legacy Amendment, and spearheaded by the Minnesota Department of Natural Resources and the Minnesota Geospatial Information Office. The six-year project resulted in a seamless, high-resolution digital elevation map of the entire State of Minnesota. This data is completely free to download and offers a vertical accuracy of six inches. This project has enabled the flow of accurate topographic information between all organizations and the general public.

LiDAR deliverables

The deliverables of the project came in different formats. The simplest and most frequently used format is two-foot contours that were generated statewide. There is also a high-resolution Digital Elevation Model (DEM) that can be acquired as county tiles. The user can generate contours at varying intervals in this format, such as one-foot or even six-inch. Both the contours and the DEM use bare earth returns, meaning you only get surface elevation.

A third format is the raw LiDAR data, which is dense collection of points, or a point cloud. If you imagine the laser from an airplane hitting the surface, it’s the information at that contact point that is reflected back to sensors on the plane. The density of those points depends on the exact collection methods, but typically there will be 2 million points per square mile, or approximately 20,000 points for a typical city block. The point cloud gives access to all the returns and not just the bare earth returns; therefore, we can gather information about the heights of trees, buildings, water towers, etc. The point cloud is so dense that it is even possible to extract overhead power lines from the data. These multiple returns allow the data to be used for many different 3D analyses and visualizations. Certain 3D software packages allow the user to take the point cloud and turn it on its side, creating a vertical profile with accurate object heights and ground elevations.

LiDAR uses

There are many uses for LiDAR data beyond viewing ground elevation or object heights. Any kind of hydrologic flow analysis can benefit from the use of this data. Erosion analysis can be done by using slope estimates from LiDAR to compute the amount of erosion in certain areas, and that in turn can be used to calculate sediment accumulations. LiDAR has also been used for flood modeling, urban planning, oil and gas exploration, and coastline management. With the wide availability of free and highly accurate topographic data, many are reaping the benefits of LiDAR data and finding that its uses are far-reaching across many disciplines.

Using NDVI to Generate Impervious Surfaces for Large Areas

By Bryan Pittman
Feb. 6, 2015

Calculating the area or percentage of impervious surfaces for a given spatial extent helps determine curve numbers, runoff rates, and pollutant loadings. Overlaying an impervious surface layer with drainage areas for a city can determine impervious percentage per drainage catchment. The issue is getting an impervious surface for a large enough area, for example a city or a Watershed Management Organization (WMO). Digitizing of an aerial can create impervious surfaces for small areas but is too time consuming on a large scale.

Fortunately, with the current availability of high-resolution Color-Infrared (CIR) aerial photography, there is a workaround that is far less time consuming. Since the reflectance of vegetation peaks in the near infrared, vegetation yields high returns on CIR photography. This can be used to generate a Normalized Difference Vegetation Index (NDVI). The NDVI is a ratio from the returns of near infrared and visible light, telling us how “alive” something is. A high NDVI ratio signifies healthy, growing, green vegetation, where a low NDVI ratio signifies something not living, say pavement or rooftops.

The typical NDVI value ranges from -1.0 to +1.0 (GIS software calculates a value from 0 to 200). In that range, there will be a cut-off point that separates vegetation from non-vegetation. The value is typically just above 0.0, but varies based on the CIR aerial photography being used. Classifying the NDVI surface into two groups from that cut-off point gives a result that shows the area of vegetation and non-vegetation. Since there is a very high correlation between areas of non-vegetation and impervious surfaces, this result shows what is impervious and what is pervious.

This method yields results that are about 90 percent accurate. First, the assumption is made that vegetation equals pervious surfaces, which is not always the case. A large area of open dirt is a good example. It is still pervious but shows up as impervious because it is not vegetation. Another issue is shadows cast by trees, houses, and other structures. Since shadows are blocking out the light return (both visible and near infrared), any shadow is interpreted as non-living and thus impervious, even though it may be a pervious surface.

Even with these minor disadvantages, the time saved is enormous. Instead of taking weeks to digitize all the impervious area within a city, this analysis can be completed in under an hour. It is necessary to perform quality control on the data and clean up any of the issues described above by reclassifying something as pervious to impervious or vice versa.


Tracking Santa: An ArcGIS Online case

By John Mackiewicz
February 6, 2015

ArcGIS Online connects maps, apps, data and people so you can make smarter, faster decisions. It gives everyone – both inside and outside organizations – the ability to discover, use, make and share maps from any device at any time. At its core, ArcGIS Online is a hosted cloud software as a service (SaaS) platform. Everything you need to create your own web maps and apps is available on ArcGIS Online. You can create maps from Microsoft Excel or upload your data from ArcMap to share your map and collect data in the field on your tablet or phone.

ArcGIS Online supports many users collecting data in the field at one time. This presents a problem for large workforces, as you may need to track where your collectors go when working in the field. Using Esri’s Collector for ArcGIS app, you can have it periodically report the location of data collectors back to a tracking layer on ArcGIS Online by publishing a tracking layer on ArcGIS Online and adding it to an Web Map with tracking enabled. When this Web Map is accessed within the collector app, the collector app sends its GPS location back to the tracking layer hosted on ArcGIS Online at a predefined interval.

At WSB, we view ArcGIS Online as a technology that:

  • Can quickly be deployed for multiple uses
  • Is flexible enough to handle diverse workflows without requiring any programming
  • Has untapped potential for public outreach

Below is one of our favorite examples of how we used ArcGIS Online to help a client deliver immediate value to both the organization and the public.

Tracking Santa

For more than 25 years, firefighters in the City of St. Anthony, Minnesota, have helped Santa by collecting gifts for those in need. Santa rides in fire trucks throughout the city collecting gift donations from residents. In 2014, the city wanted to allow residents to track Santa’s location along his route.

The City of St. Anthony decided to utilize ArcGIS Online to track Santa, thanks to all the app’s capabilities.

Here’s how we did it:

  1. A tracking layer was published on ArcGIS Online.
  2. The tracking layer was added to a Web Map configured with the city’s custom Esri base maps with tracking enabled.
  3. The city deployed an iPad with the Esri Collector for ArcGIS app to ride along with Santa with the Web Map open on the fire truck.
  4. A custom web app was built using our DataLink platform to show Santa’s most recent location.

As the fire truck drove along its route, the collector app was configured to report the truck’s location every 30 seconds back to ArcGIS Online. Residents used DataLink to view Santa’s current location in relation to their house so they knew when Santa was arriving.

Tracking Santa’s location is certainly a unique use of ArcGIS Online, but it shows how extensible the ArcGIS Online platform is. With just a few clicks, you can begin to track real-time locations of users who are using the collector app.