The molecular structure of COVID-19 is complicated. The ectodomain, also known as a surface protein, is complex. The 3D visualization focuses on just one of the surface protein complexes that protrude from the surface of the virus. All 21,539 atoms and 20,995 bonds visualized show how the attachment mechanism connects to the host cell. You’ve probably seen various generic models all over the news, but nothing compares to the actual molecular structure. Knowledge of this structure is helping researchers define and design proper pharmaceutical responses.
To create this visualization, data was pulled from the Worldwide Protein Data Bank. Developed using advanced visualization tools, expertise and software, the visualization is an accurate portrayal of COVID-19 that shows how complex the virus actually is.
By Dan Pfeiffer, Director of Public Engagement, WSB
As many states across the country issue stay-at-home or
shelter-in-place orders, our communities are still forging ahead behind the
scenes with many infrastructure projects that are essential to our lives and economic
health when we move beyond Covid-19. Many of these infrastructure projects rely
on public engagement efforts to help guide decision-making and gain valuable
feedback. Delaying project progress by canceling engagement activities is not
an option when timelines and construction need to continue forward or when
working in areas with shorter construction seasons.
There isn’t a one size fits all solution when determining
ways to effectively engage with stakeholders. When typical engagement methods
of in-person, small group and stakeholder relationships are not possible,
staying connected to the public is still possible and effective.
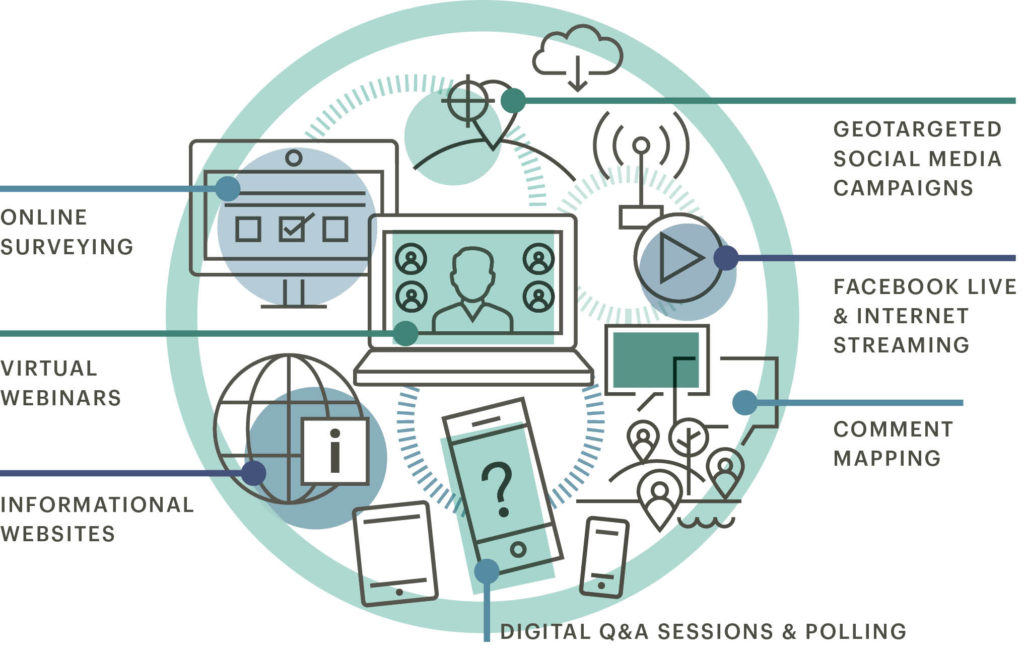
Digital and Virtual Engagement Methods
Connecting with audiences virtually offers a more flexible audience who can engage where and when it’s convenient, but standing out amongst the noise and distractions can be challenging. It’s important to capture their attention right away since they are a mouse-click or new link away from not being engaged. Some effective tools include:
Engagement Methods When Barriers Exist
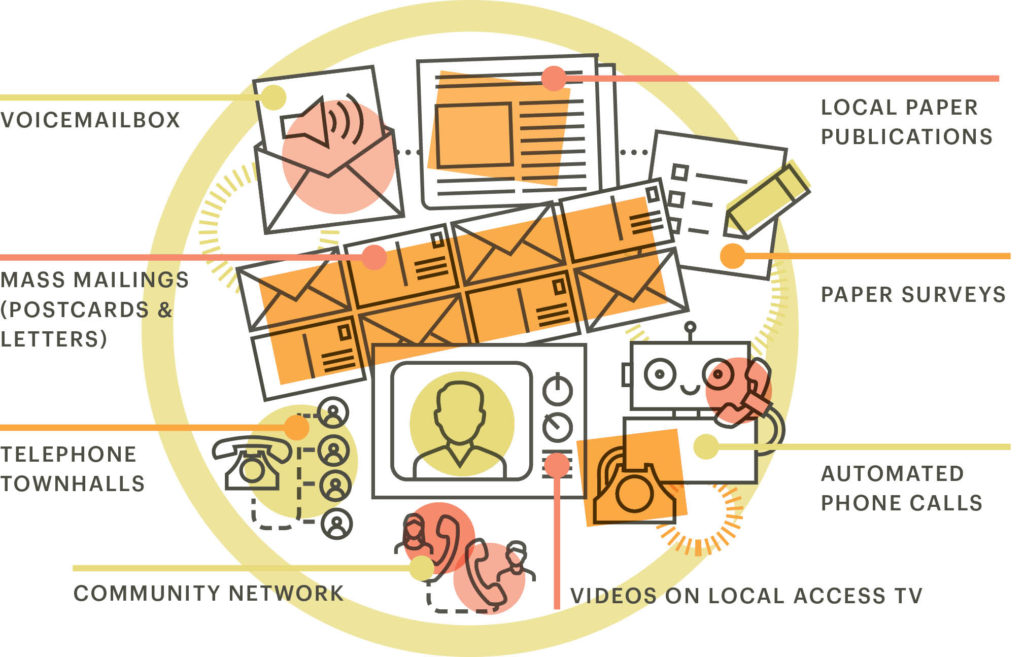
Barriers to participation in a digital environment exist. Access to internet, internet connection speed and computer literacy are all challenges that communities may face. When engagement is needed in communities that lack internet, cell service or other technology barriers, finding ways to connect with stakeholders requires some creativity. Some effective tools include:
Dan has more than ten years’ experience leading teams, as a team leader and operations assistant in the Army, and Minnesota Army National Guard and over eight years in public engagement. He has completed the International Association of Public Participation’s Foundations in Public Participation, the National Transit Institute’s Public Involvement in Transportation Decision-making courses.
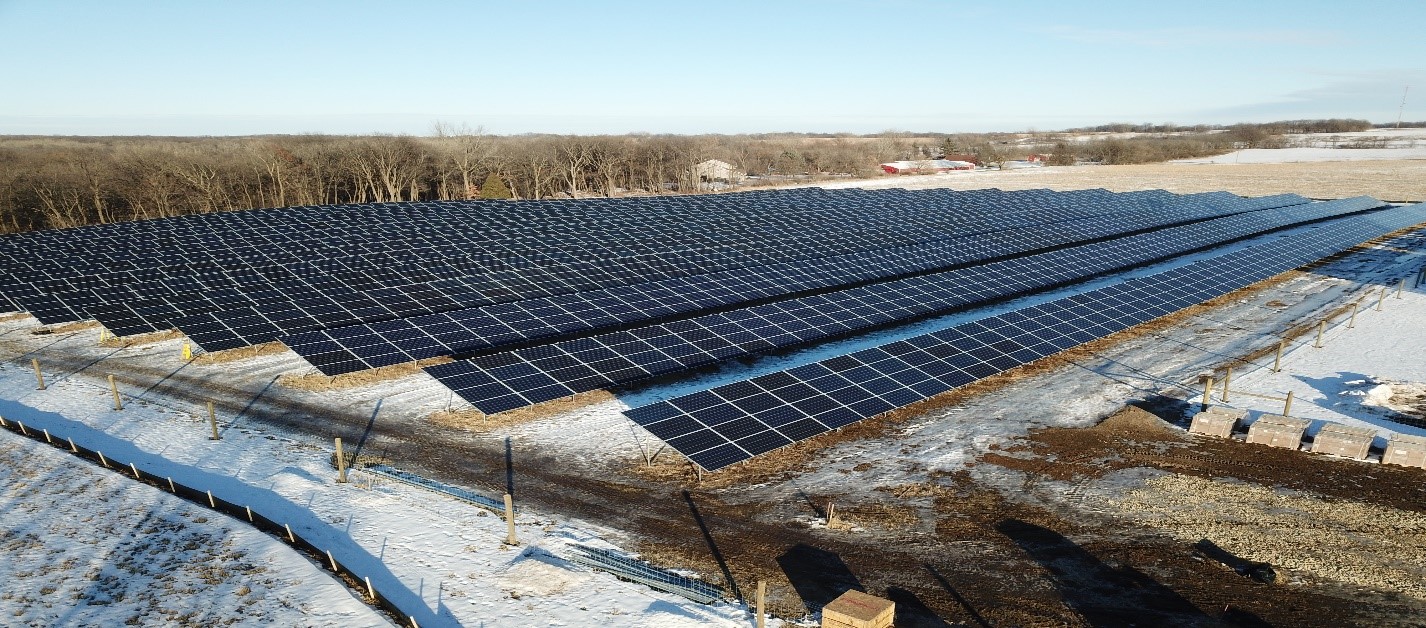
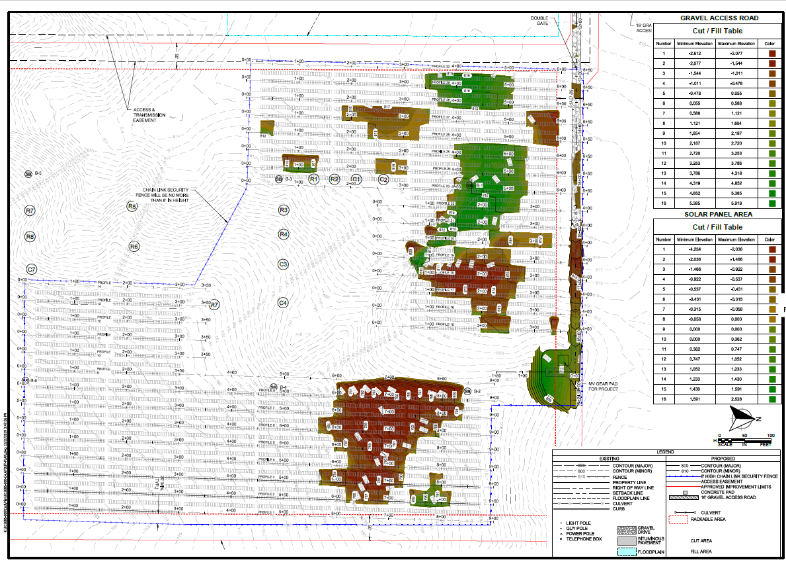
WSB’s Renewable Energy Solar team continues to innovate in the industry and expand our expertise. Most recently we developed a system to quickly and efficiently analyze and compare solar site grading costs. Even a 6” cut or fill across a large site can result in substantial costs making a site less attractive, or impractical, for a developer. Analyzing rows and rows of solar panels conventionally has been tedious and time consuming. Our new, automated CAD processes makes the analysis more efficient and cost-effective.
Methodology
The automated processes uses Civil3D. It allows the user to input tolerances from different panel types and desired racking lengths to generate a proposed grading surface. The system produces a thematic mapping of grading cut and fill quantities for areas within the array footprint on a micro level.
Analysis & Results
As solar developers know, site grading costs can make or break a project. Being able to quickly and efficiently apply this technology to small and large sites allows a developer to compare, evaluate and determine which sites are most cost-effective from a grading standpoint. We can further refine array layouts to efficiently and cost-effectively fit within the site terrain, minimizing the amount of site grading required.
Similar technology takes structural pile plans and produces a plan and point file of X, Y, and Z coordinates. That information can be downloaded to the surveyor, in the field, to pinpoint the exact location and elevation of each individual pile in a project, anything from 1 MWac sites to 500 MWac sites and larger.
Geography
As a national company, WSB can apply this process to any site around the country. Our Renewable Energy team has worked on renewable energy projects across the country and can provide a full set of services for solar projects; services include, but are not limited to, Critical Issues Analysis (CIA), Engineering and Site Planning Approvals, Construction Surveying, and Geotechnical Services.
What’s next?
WSB continues to develop techniques and solutions to ensure the success of client projects. From Site Selection software to automated Micro-Grading Analysis, WSB continues to innovate and lead the Renewables market.
Jeff is a licensed Civil Engineer and Senior Project Manager at WSB. He has over 26 years of engineering experience in the areas of municipal, commercial development, and consulting engineering. Jeff has worked with many municipalities and has a wealth of experience in working with local, State, and Federal permitting authorities.
You are currently browsing the WSB blog archives for March, 2020.