By Andrew Plowman, Director of Transportation Design, WSB
Exploring the why behind the twists and turns of road design.
Throughout the COVID-19 era, many Americans have opted out of air travel and are instead packing up their cars and hitting the road for an old-fashioned road trip. A survey conducted by Farmers Insurance found that more than 60% of people are planning to travel by car or RV over the next few months. But as we weave and wind our way through the mountains or travel over the hilly plains, our minds can wander into the why behind the infrastructure that’s bringing us to our destination. We ask, why do roads curve?
There may seem like there is no rhyme or reason to the sharp curves or slight turns along interstates or highways, but there are many reasons roadways curve.
Right of Way
If you’re a rancher, you certainly wouldn’t want a highway slicing down the center of your land. In many cases, Right of Way causes a road to curve around a piece of property rather than through.
Subgrade Conditions
The subgrade is the existing soil located below the pavement and aggregate layer of the roadway. At times, the existing subgrade is made up of organic material or clays that will continue to settle. As the roadway settles it can crack causing damage over time. Rather than dig very deep to remove this material, a roadway alignment may curve out of the way to miss the bad soil conditions.
Profile Considerations
Profile considerations become increasingly important in states where roads need to climb to different elevations. To maintain a grade that isn’t too steep, a road will curve from Point A to Point B to gain distance which flattens the slope.
There are many reasons a road may curve that extend beyond this list. The technical aspects of roadway design are vast. As you make your way to your next destination, see if you can spot the reason a road may curve.
Andrew is a transportation project manager and lead design engineer with over 17 years of experience who has designed more than 80 roundabouts. He is involved in all aspects of roundabout design, including geometrics, traffic operations, staging, and adhering to ADA standards. He has educated communities on the benefits of roundabouts and their safety for managing traffic. Andrew has also shared his professional knowledge nationally at international roundabout conferences.
Underground pipeline infrastructure is expansive and vulnerable to natural disasters, extreme weather conditions and impairment from human activities. When systems fail, they can trigger catastrophic damage and global headlines. In 2018, extreme weather incidents cost the United States nearly $91 billion. Earthquakes, landslides, tornadoes and hurricanes have a huge impact on our above-ground infrastructure but can also significantly affect our less visible underground infrastructure.
To prepare for the fallout caused by extreme weather events, many private and public organizations are taking a proactive approach to managing their geohazard risk.
PRIVATE REGULATIONS
Private utilities who operate interstate pipelines are held to requirements enforced by the Pipeline and Hazardous Materials Safety Administration (PHMSA). These requirements provide guidance on how to manage operations when faced with extreme weather or natural disasters. Beginning in July 2020, PHMSA’s updated requirements will mandate the consistent monitoring of all pipeline systems throughout the United States. While regulations existed previously, the integrity management systems associated with pipeline infrastructure have been evolving in response to extreme weather.
To comply with the PHMSA’s requirements, many private oil and gas companies are developing and updating integrity management systems, a risk-based approach to improving pipeline safety and operations.
PUBLIC REGULATIONS
Instead of creating integrity management systems, public organizations create resiliency plans. These plans improve public safety, allow for more precise project scoping and cost estimating and provide more accurate forecasting for maintenance budgets. Additionally, resiliency plans help communities plan their budgets proactively.
BUT HOW DO YOU MONITOR UNDERGROUND INFRASTRUCTURE THAT SPANS MILES?
Traditionally, many companies and organizations have resorted to walking the entire pipeline system to measure where risk may occur in the event of a natural disaster or extreme weather event. This process is time-consuming and often not fast enough in response to a crisis or when quick decisions must be made.
Our team of geohazard experts knew there had to be a better way to assess geohazard risk. Working closely with both public and private clients, we developed a predictive tool that allows organizations to monitor their pipeline infrastructure virtually. This GIS-based geohazard model informs risk-based decision-making tools, such as risk matrices, that can be referenced to ensure PHMSA compliance or inform resiliency planning. Using the model, areas that may have been impacted by an extreme weather event can be monitored with the click of a button and action steps can be taken immediately to continue safe operations of the pipeline network.
THE IMPORTANCE OF MANAGING GEOHAZARD RISK
With changing severe weather patterns around the country, proactive management is becoming an increasingly important part of pipeline operations. Since the 1950s, precipitation occurring during heavy downpours has increased by 37% in the Midwest. These events increase the probability of landslides, flooding, and a host of other geohazards that may negatively impact pipeline integrity.
Identifying locations vulnerable to these types of events allow mitigation activities that are less expensive than addressing them after an event has occurred, making geohazard assessments a sound risk and financial management tool.
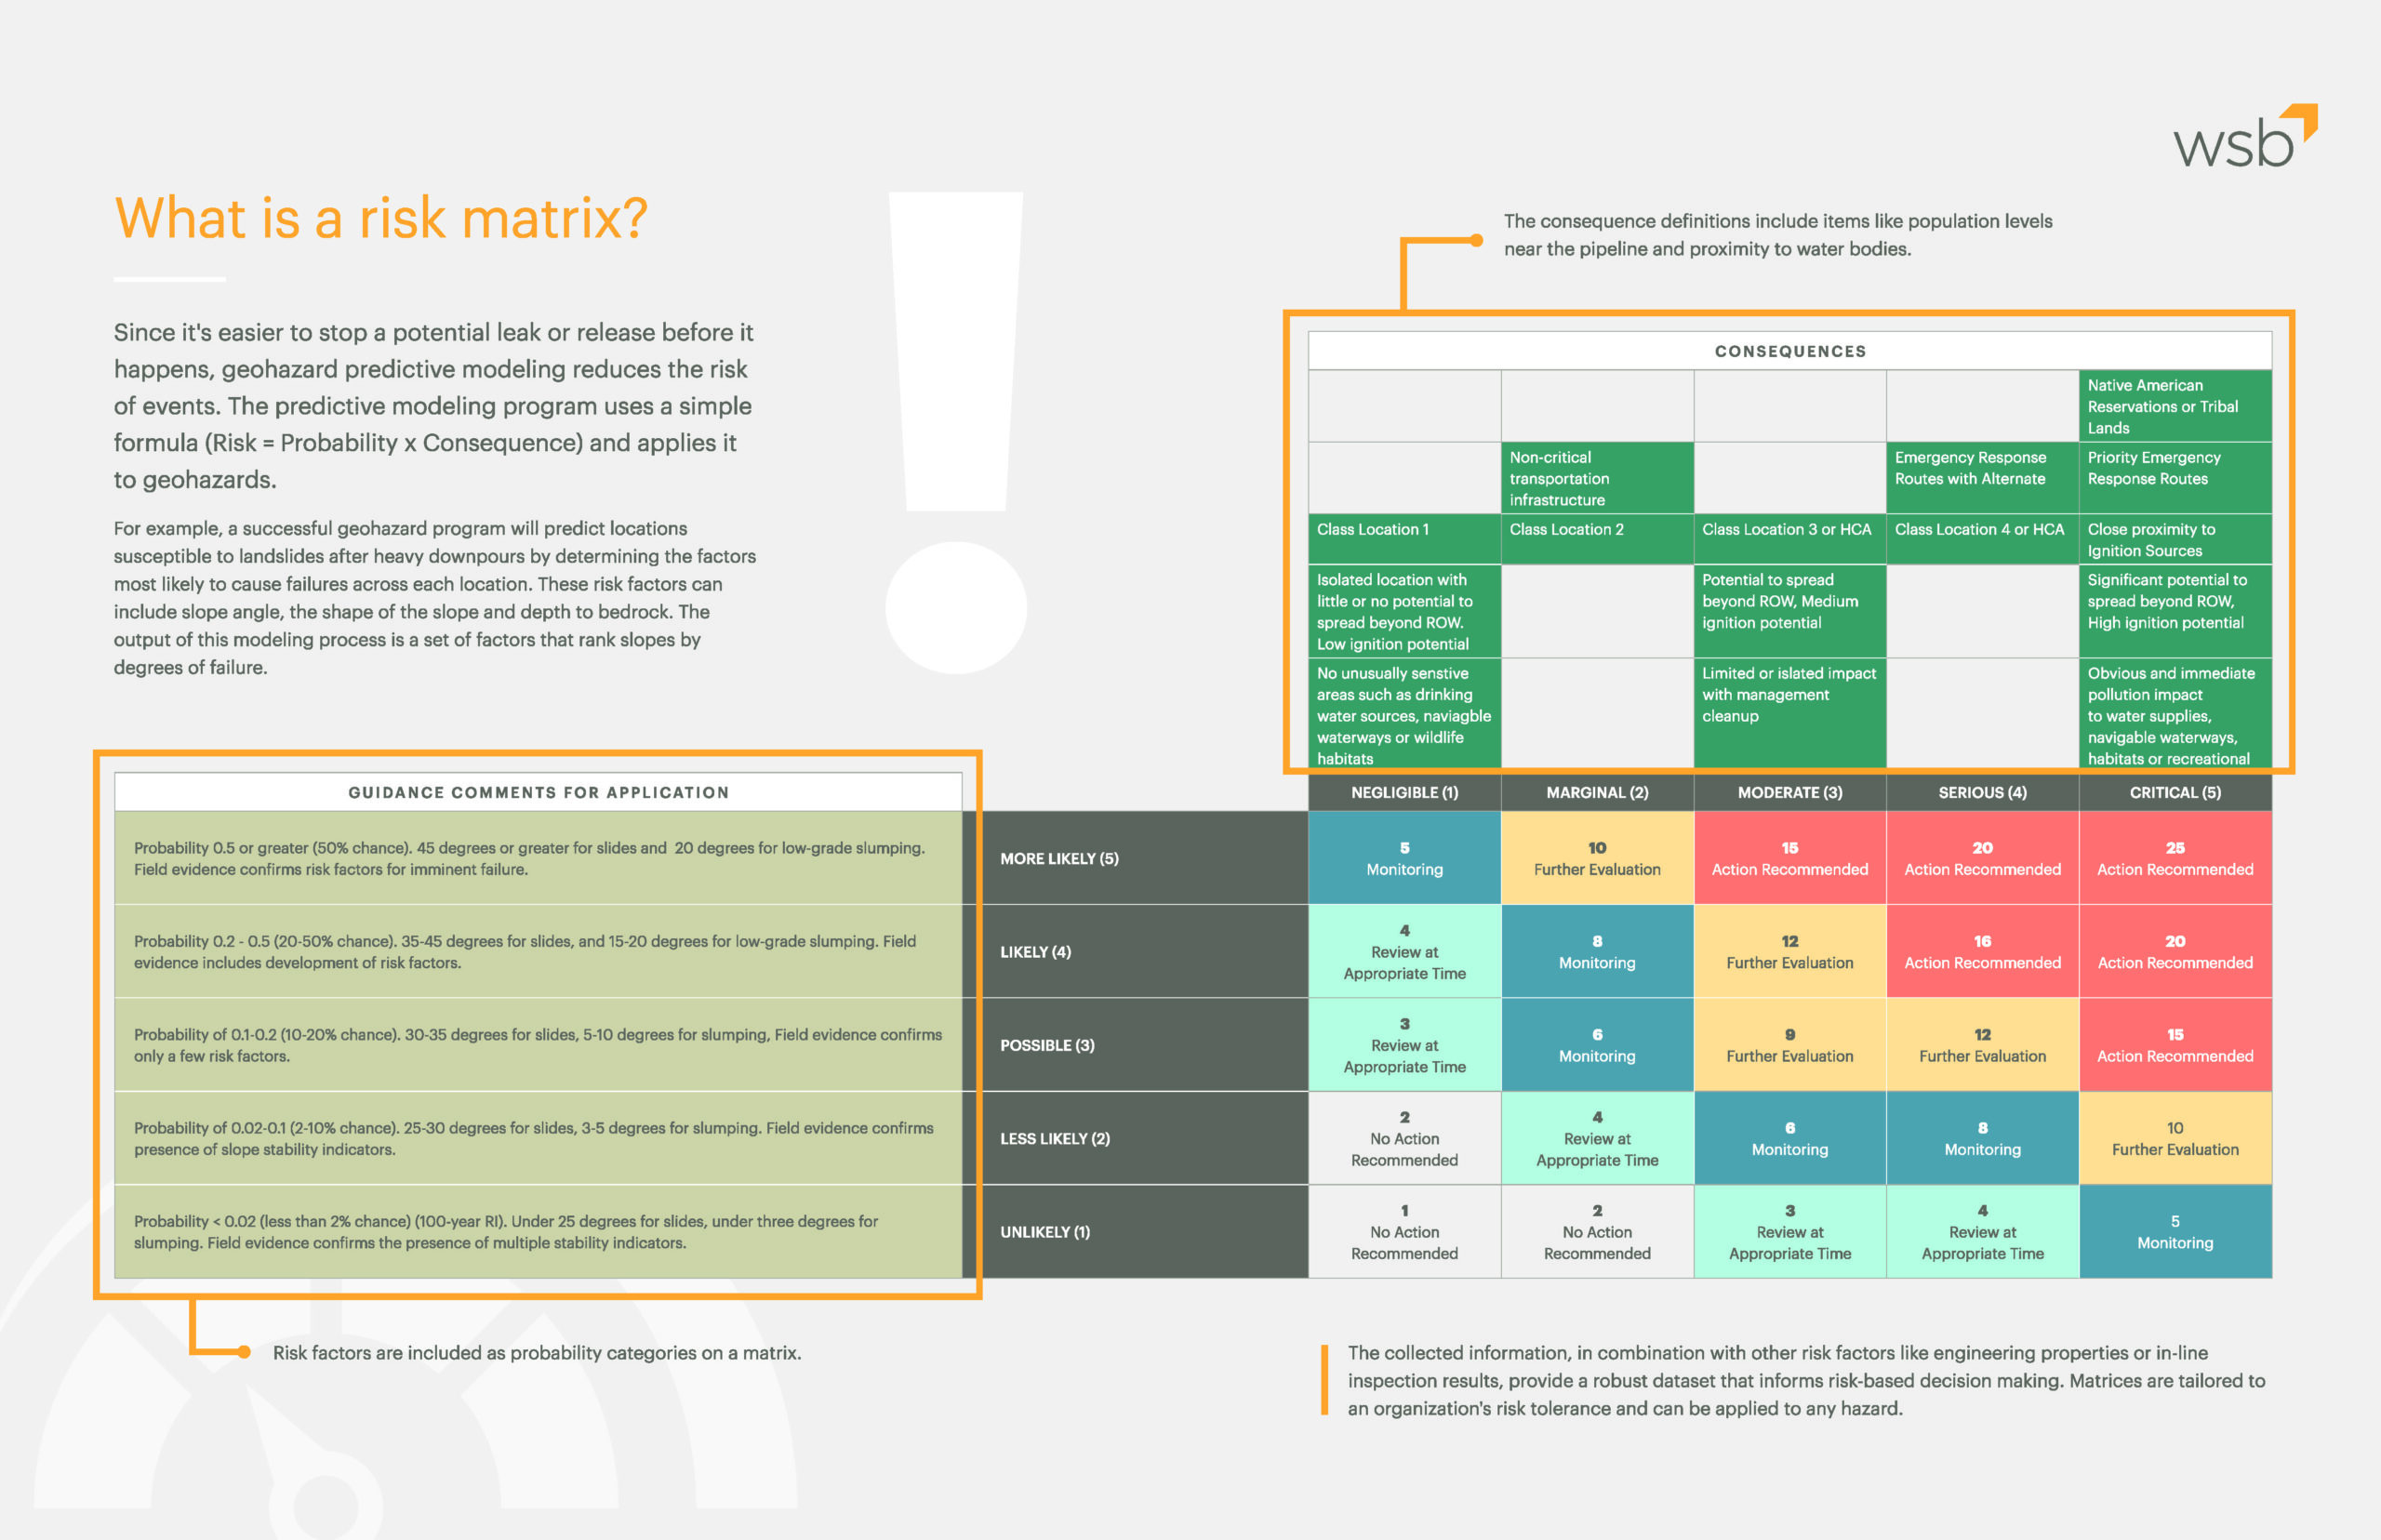
WHAT IS A RISK MATRIX?
Since it’s easier to stop a potential leak or release before it happens, geohazard predictive modeling reduces the risk of events. The predictive modeling program uses a simple formula (Risk = Probability x Consequence) and applies it to geohazards.
For example, a successful geohazard program will predict locations susceptible to landslides after heavy downpours by determining the factors most likely to cause failures across each location. These risk factors can include slope angle, the shape of the slope and depth to bedrock. The output of this modeling process is a set of factors that rank slopes by degrees of failure.
Soon Minnesota’s Municipal Separate Storm Sewer System (MS4) communities will continue the reissuing process and applying for coverage under the revised MS4 General Permit. The updated MS4 General Permit is expected to be reissued by the Minnesota Pollution Control Agency (MPCA) this Summer of 2020. This will create significant changes in the ways that MS4 permittees will operate, starting with modifications to address any procedural and programmatic changes needed as a result of the updated rules.
Below are
the Top 5 Proposed Changes – What You Need to Know
Volume control requirements to treat all new and fully reconstructed impervious surfaces equal to one or more acres.
New performance-based responses to chloride, bacteria, and temperature TMDLs; including a written plan to identify and prioritize activities to achieve reductions.
Additional education and outreach efforts on salt use and pet waste.
Increased responses to snow and ice control operations. Improved management of salt storage at commercial, institutional and non-NPDES permitted industrial facilities.
Additional documentation requirements to better evaluate permit compliance and SWPPP effectiveness.
The MS4 permit application process is a two-part process. The first includes the permit application fee, contact information for the applicant, and applicant certification. Existing permittees have already completed this step in late 2017 or early 2018. The second part, known as the Part II Stormwater Pollution Prevention Program (SWPPP) Reauthorization Application document, includes information about the applicant’s current SWPPP. It compares it to the revised permit rules and identifies action permittees will take to be compliant with the updated MS4 rules.
Once the MS4 permit is reissued by the MPCA, there will be a 5-month (150 days) period for applicants to submit an application electronically through the MPCA’s website to the MPCA Commissioner for review. After permit applications have been approved by the MPCA, the new SWPPP document will be placed on public notice for 30 days with the opportunity for a hearing on the preliminary determination. Following the public notice, permittees will have 12 months to update their MS4 programs to meet the new permit requirements. Our Environmental Compliance group is familiar with every step of this MS4 permit reissuance period and available to assist.
In the meantime, MS4s must continue to implement their programs and follow the expired MS4 permit’s rules. This means that routine efforts to provide education and training, identify illicit discharges, and monitor and maintain the MS4 system must continue. MS4 permittees are also expected to continue their erosion control inspection schedules and monitor active construction projects despite the COVID-19 pandemic. Inspectors are encouraged to wear masks and maintain social distancing standards while out on site. Our Environmental Compliance team is available to help your community meet this permit requirement. We can help augment site audits by regulators, provide temporary inspection support, carry out enforcement protocol, and provide any other support to help local erosion control programs.
Please contact us for additional assistance or questions.
Meghan Litsey is director of our Environmental Compliance team and has over eight years of experience. She specializes in providing environmental compliance services in construction site permitting, SWPPP design and inspection, and MS4 program development.
By Erin Perdu, Director of Community Planning & Economic Development, WSB
How do we design for the urban environment? While the term “urban” may make you think of a concrete jungle with a bustling vibe of major U.S. cities like New York City and Los Angeles, an urban environment is any population center, from small towns to mid-sized cities and beyond. According to the U.S. Census Bureau, more than 80% of Americans live in urban areas. By 2050, nearly 90% of Americans will live in cities. When we talk about urban design, we’re not just talking about skyscrapers and high-speed trains: we’re talking about designing for the communities where many of us already live.
As cities of all sizes are experiencing growth, communities are increasingly looking for thoughtful expertise to foster greater connections between people and places. This can include planning and zoning, economic development, architecture and landscape architecture, transportation and infrastructure, and many other factors that contribute to the look and feel of a space. Urban design can’t be defined by one discipline, project or service. WSB’s multidisciplinary team of professionals helps communities enhance their urban environments through public engagement and thoughtful, holistic design.
KEY QUESTIONS TO ASK
Urban design enhances the relationship between public and private spaces by considering a variety of issues, including some of the following questions:
HOW DOES SOMEONE ACCESS A BUILDING ENTRANCE FROM A SIDEWALK?
HOW DOES SOMEONE ACCESS A PARK FROM THEIR HOME?
WHERE CAN PEOPLE GO TO CONGREGATE AND CELEBRATE PUBLIC EVENTS? ARE THESE PLACES INVITING TO RESIDENTS OF MANY CULTURES?
WHAT ELEMENTS ORIENT PEOPLE SO THEY CAN FIND THEIR DESTINATION?
HOW DO KIDS GET TO SCHOOL SAFELY?
HOW MANY DIFFERENT WAYS CAN SOMEONE GET TO WORK IF THEY CAN’T OR DON’T WANT TO DRIVE?
HOW DO WE EXPERIENCE DESIGN IN THESE SETTINGS? WHAT INFLUENCE DOES GOOD URBAN DESIGN HAVE ON CULTURE?
HOW IT WORKS
Urban design starts with imagining the possibilities. Typically, we work with clients to create holistic visions for corridors, neighborhoods, and centers in both the public and private realm. We work together to shape cities, influence culture and focus visions.
Communities should look at a specific part of the urban environment they want to make better and take the opportunity to think bigger. Engaging the public in the initial stages is key to understanding how people interact with a place and how these interactions meet their expectations. This results in spaces that are functional, friendly and accessible to the community.
Urban design happens in a variety of places and scales – from a streetscape or alley to a neighborhood, to a district or an entire city. Urban designers create everything from small-scale plans to design guidelines to long-range plans for our communities.
We also consider the economics of the design to create projects that are sustainable, economically viable and even enhance economic productivity within a community. This is derived from conversations with landowners, businesses and developers within the private market that will partner with communities to create these places.
Beyond a single project or discipline, urban design is a comprehensive, multidisciplinary approach that enhances the environment by creating great spaces for people. Urban design relies on the wider context of an urban environment and all its components, including history, human behavior, infrastructure, the economy, climate, ecology, equity and sustainability. By planning with the wider context in mind, urban design creates people-centered places that raise the quality of life for everyone in the community.
Erin is a community planner and project manager with 22 years of professional planning experience in both the public and private sectors. She has worked as a staff planner and Community Development Director for multiple municipalities.
Our
Traffic Operations team recently developed a large-scale traffic simulation
model for the Minnesota Department of Transportation (MnDOT). The current model
is used to track vehicle congestion on interstate 94 (I-94), including the
15-mile stretch of highway between Minneapolis and St. Paul, commonly known as
one of the most congested corridors in Minnesota.
The
I-94 corridor generally supports a high volume of traffic during morning and
evening commute times. Travel patterns on this corridor are complicated due to
the roadway geometrics and vary with each commuting experience. Drivers risk
getting stuck in several hours of traffic congestion depending on their travel window.
Beyond
day-to-day commuting traffic, Minnesota roadways have a large amount of freight
traffic to consider. WSB’s simulations
help to better understand the origin and destination of freight flows as well
as help better identify bottlenecks for freight traffic. This is important as the freight industry is
a vital component to the regional and state economy. When goods are free
flowing, avoiding time consuming bottlenecks, the direct impact is noticeable,
and Minnesota’s economy becomes stronger.
The
microsimulation tool uses geospatial, Federal Highway Association (FHWA), and
other historical data to capture the speed and flow of highway traffic. State-of-the-art
software allows us to monitor complex highway and arterial traffic conditions
more efficiently while tracking the dynamic interactions between vehicles.
Daily traffic congestion is tracked and recorded using heat mapping and other
reporting tools. The interactive model depicts several modes of transportation
operating during peak commuting hours. Collected data is analyzed for accuracy
and applied to determine future transportation planning initiatives.
The true benefit of this technology is our ability to run a higher
number of alternatives at a pace the industry has never experienced
before. We can now study ten times the alternatives in under half the
time it took only a year ago. It’s a true game changer for our
industry. And for our partners, they are reaching solutions sooner that
are much more economical. In doing so, we’re saving them valuable time
and money. Ultimately, we’re helping our clients ensure they are
allocating their resources in the right places at the right time.
Moving forward, our goal is to continue to leverage the latest technology to identify operational deficiencies more quickly for our partners and help to develop future alternatives that support a more reliable commute.
As Vice President of Transportation, Jody oversees the management and operations of the WSB Transportation group. Jody is the former Assistant Commissioner of the Minnesota Department of Transportation (MnDOT) Operations Division and has over 25 years of experience in the delivery of major transportation projects, programs and management of existing infrastructure.
There are many challenges to maintaining a healthy and prosperous tribal community. Tribal leadership is responsible for building, maintaining and improving the infrastructure and services for tribal members on an on-going basis. This can be daunting and overwhelming when the necessary resources are not readily available. The good news is there are a variety of funding sources available to tribal communities, here are the first steps you can take when applying for funding.
1.) Prioritize goals and align with available funding
options
In many instances, tribal sovereign nations have developed
planning documents such as integrated resources management plans (IRMP), comprehensive
plans, housing plans, surface water management plans, economic development
plans, cultural preservation plans, and many others. Having clear goals and
aligning them with available funding opportunities will position your tribal
community for success at acquiring critical funds for initiatives that are most
important.
Funding is available from a variety of local, state,
federal, and non-governmental organizations (NGOs) and all have eligibility
requirements and allowable expenses. Others may require match (in-kind or cash)
and have minimum/maximum funding requests amounts. Understanding these basic
requirements is a prudent second step in deciding if pursuing a funding source
will be worth the investment of time and how well the grant can support the
project.
3.) Develop partnerships/coalitions
Funding requests can vary greatly based on need and scale of
the project or program. For large projects that require a large capital
investment or match that may not be available, consider developing partnerships
or coalitions with local, state, federal, or NGOs to security necessary funds.
This can allow you to leverage multiple funding sources, expertise, volunteers,
and support, which in most instances increases your chance obtaining grant
funding.
4.) Determine what type of project needs funding
Projects and grant requests may divide into broad categories
such as:
Education/Outreach
Data Collection
Implementation
Monitoring
Planning
Depending on where your community is with planning and
datasets, new projects may need to begin as planning projects and include
implementation plans. This will help you describe your project and develop a
clear workplan to successfully achieve tribe goals. Some funding sources do not
support planning or data collection and simply support project implementation, while
others are the opposite, only supporting planning and data collection and not
implementation. Therefore, addressing points one and two is critical to your
application and should be as persuasive as possible to demonstrate that you
have a clear set of goals and implementation plan. In some cases, including
elements from each of the above categories on applications, or at least
addressing them, can improve your application and odds of being granted funds.
5.) Plan for what comes next
Having a clearly defined workplan and accurate cost estimates
for your project/program is critical to successfully winning grants. If there
are too many expenses exceeding currently available funding, consider phasing
your project over time and explain that in your grant application. It is
possible to be awarded funding on a multi-phase project that is implemented
over a series of years if it follows a clear plan. Be thinking about what comes
after completing the workplan. Consider how you will fund and support the
project after the grant is completed.
Many times, grant programs can build on themselves; after successfully
obtaining one funding source and completing the project, you may unlock
additional funding sources to expand the reach of your initial project.
Other things to consider:
Capacity Building- Do you have capacity (staff, equipment,
time, etc.) to complete the project and can you use grant funds to build
capacity that provides future opportunity?
Data driven- Can you use existing data to support your
rationale for the grant funding? If not,
this may be your request as you identify data gaps and request funds top fill
those gaps.
By Jason Amberg, Director of Landscape Architecture, WSB
Communities can better plan for their future by developing a system-wide comprehensive park, trail, and recreation master plan. Public engagement, intentional planning, and aligning needs with recreation trends are challenges communities may face when planning future park systems. Acknowledging these challenges is crucial for creating a successful park system plan that meets the needs of its users.
1. Establishes a long-range vision
Establishing a long-range plan helps ensure that resources are used effectively, and priorities are based on the greatest community benefit. Aligning the vision of a community to the system plan helps meet the needs of the public and establishes a clear plan of action.
2. Prioritization and budgeting for Comprehensive Improvement Plans (CIP)
Priorities are established through a park system planning process. From high-level budgets to determining a proposed timeline for implementation, developing priorities provides a better perspective of what is possible. As populations grow, the park system should develop and grow as well. Communities can make a strong impact when aligning their priorities and investments across the system.
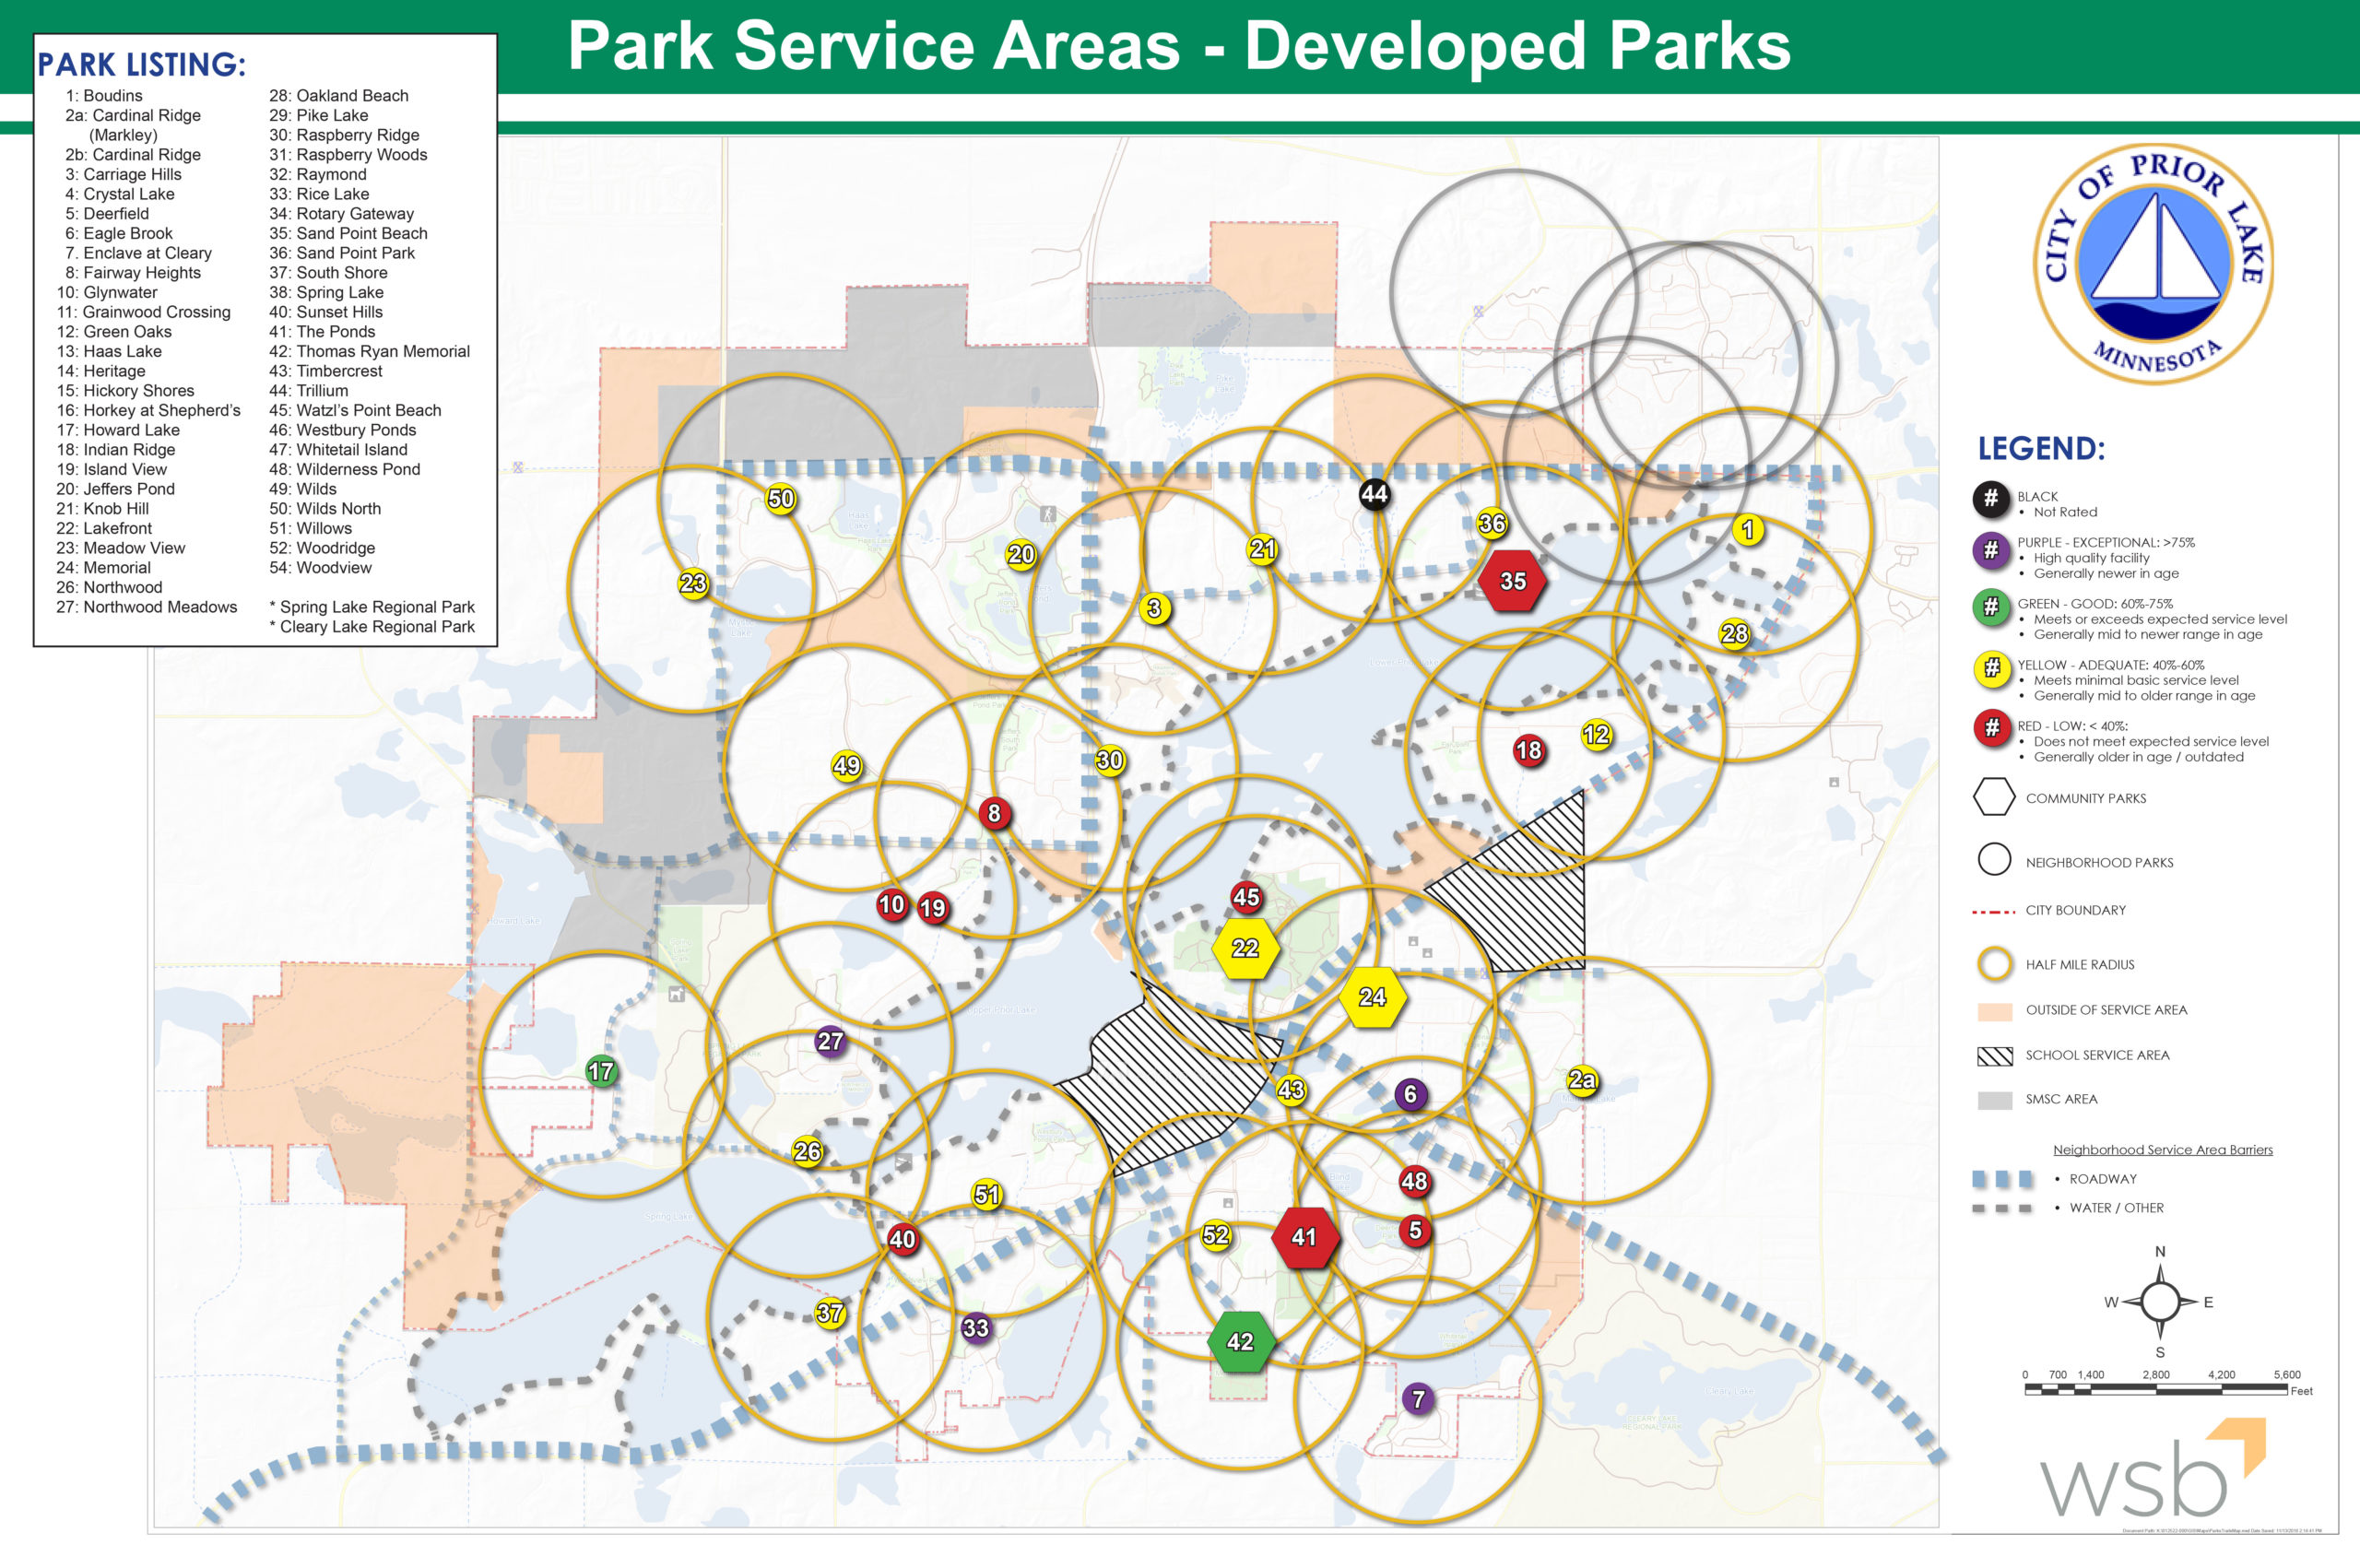
3. Filling gaps and reducing redundancy
When preparing a system plan, analyzing the distribution of parks and bike/pedestrian connectivity is essential to gain a better understanding of existing gaps and overlaps. Changes can then be better implemented to serve residents that may be lacking proper access to recreation and reduces overlap where similar recreation opportunities exist. Analyzing the distribution and connectivity of parkland in a system develops opportunities for active and passive park options that can include unique playgrounds, courts, plazas, sports fields, picnic areas, overlooks, etc.
4. Community support
There are many ways to engage stakeholders, both in-person and virtually. Open houses, community events and online engagement methods create opportunities for public involvement. Not only does public engagement generate community support for funding, but it also provides relevant perspectives from the broader community to ensure the system plan accounts for diverse users, improves transparency and builds trust. Increased public engagement is leads to increased future community support. of community members.
5. Potential for and promotion of partnerships
System plans also identify private and public partnership opportunities. These partnerships may include school districts and private educational facilities, fitness centers, associations, townships, watershed districts, state agencies, and other municipalities. This collaborative effort helps communities build and deepen existing or new relationships.
6. Grant application tools
Many grant funding applications require a public engagement process and an adopted plan. From trails to park development, the system plan shares a clear vision and budget estimates that are based on public input. As public engagement becomes increasingly important, organizations are looking for park planners who connect with community members through a variety of methods. The system plan provides the necessary background information, community perspective, priorities, budgets, and exhibits necessary for grant funding applications.
7. Opportunities for future development
System plans may recommend communities set aside open space and preserve land to accommodate population and spatial growth of the area. Census data, demographics and regional trends all help determine the amount and type of land needed in the future. The system plan is meant to help cities work with developers as growth occurs to ensure future recreation needs are met.
8. Establish a plan for the park amenity life cycle
Park systems in many communities were established using a ‘cookie-cutter’ approach to park development. This occurred over a short period of time when development was booming through park dedication dollars. While recreation needs may have been met for several years, this approach led to many parks looking nearly identical. It also created the need for simultaneous rehabilitation requirements as many parks reach the end of their lifecycle at the same time. Establishing a strategy for completing upgrades that allow park spaces to be unique and complementary to one another will reduce the future likelihood that several parks require a full replacement simultaneously. This also allows cities to budget for replacement costs not funded by park dedication dollars.
9. Aligning investment with needs
Proactive consideration of recreation trends reduces the need for further investment in downward trending park features. Current and projected recreational trends should be considered before investing into rehabilitating existing park amenities. As demographics continue to evolve, the needs for park and recreation program offerings will change.
10. Physical and Mental Health Benefits
Parks, trails and natural open spaces provide residents with both physical and mental health benefits. Whether it is a walk on a trail, connecting with nature, playing outdoor sports, or interacting with play equipment, data indicates that recreation improves health, interaction with others, and enhances community pride.
Jason is the Director of Landscape Architecture at WSB with more than 25 years of experience in public space planning and design. From small-scale neighborhood park improvements to comprehensive park and trail system plans, Jason has worked with park boards, municipalities, governing agencies and community residents.
When beginning the development of a wind farm, it’s not just the physical design of a property you should consider, but the environmental factors as well.
Consider the eagles before development
As environmental scientists, our role is to inform our clients about the risks to natural resources and wildlife; in particular, avian life. Using information about the natural environment, we can provide recommendations to our clients for ideal locations to construct potential wind turbines. Wind energy infrastructure can pose a great risk to birds and eagles and our research helps protect them from turbine injuries and/or fatalities. If an eagle is killed or injured by a windmill, the wind farm owner may be in violation of a federal law and face a penalty.
Wind farm eagle surveys
WSB has recently
been collecting data about the presence of golden and bald eagles at a wind
farm project in Montana. In recent surveys, golden eagles have been observed at
the 6,000-acre site and are potentially at-risk from the wind farm development.
Golden and bald eagles are protected by the Bald and Golden Eagle Act created
in 1940 (and expanded to include goldens in 1962). When protected species are
found to be present on a development site, an extensive two-year study, data
analysis and risk calculations must be considered prior to development.
WSB understands
and adheres to the recommendations and guidance of the region 6 USFWS and the
2013 Eagle Conservation Plan Guidance when conducting site assessments for
eagle use at potential wind farm locations.
Two-year data collection
This past
September, we began a two-year process of raptor point count surveys to study
eagle land and air usage at the wind farm site. Our environmental scientists
visit Montana monthly to collect data regarding eagle activity at the site
location. Field work during these evaluations includes visual eagle activity
surveys, eagle nest surveys, and eagle prey abundance observation that can be used
to identify the impacts of a wind farm on avian life.
We compile and
record information about the weather conditions, species sitings, eagle flight
paths, eagle behavior, and age class. Our scientists are not only measuring
avian activity but also noting whether eagle prey, such as antelope and prairie
dogs, are present. We then analyze, compile, and summarize the data for our clients.
At the end of the two-year study, all data will be analyzed forecasting the
potential risk to eagles from wind farm development. If risk levels are high,
the client can apply for an eagle take permit through the United States Fish
and Wildlife Service (USFWS) and develop an Eagle Conservation Plan for the
site.
Eagle
safety is our top priority
Not all wind farms require an extensive two-year study as each potential site is different. If protected species, such as eagles, or species of concern aren’t present or observed at the site, the above approach may not be required. When risk levels for harming avian and raptor life are low, the process of wind farm development and construction can be streamlined.
This renewable energy source poses less risk to birds and wildlife than other energy sources, but it’s important to take the necessary precautions before development begins. Our environmental scientists evaluate conservation risks and make evidence-based recommendations for research, best management practices and siting locations that protect avian species with a low amount of risk. The goal for wind farm development is to help our clients develop renewable energy resources while reducing impacts to wildlife.
Environmental Scientist, Jordan Wein explains how tracking the activity of raptors can support wind farm development and minimize the risk to raptors and other birds.
As a city leader you are responsible for many things;
managing budgets, people, community needs, city assets, and the list goes on. What
if there were a system in place for managing one of your largest assets, the
city streets?
A pavement management program provides a systematic method
of inspecting and rating the pavement condition of your roads; including the
analysis of various maintenance and rehabilitation strategies. As part of the
program, we use pavement forensics to identify the pavement structure and
condition underneath the visible surface of the pavement. We look at the depths
and condition of the pavement layers, signs of bonding or de-bonding, and
distresses that may not be visible from the surface. Data collected from the
pavement cores during forensics, provides a better understanding of the roadway
sections and allows us to determine cost-effective and appropriate pavement
rehabilitation techniques. The program is designed to help you get the most out
of your available resources.
The collected data is used to evaluate funding needs and, in
some cases, implement new funding tools such as franchise fees. We conduct
analysis on various budget scenarios to help you forecast the funding required
to maintain your network of roadways. The inspection results are useful for
talking with residents and City Council Members regarding necessary road
improvements and are vital in justifying the funding needed to maintain city
streets as part of your Capital Improvement Plans.
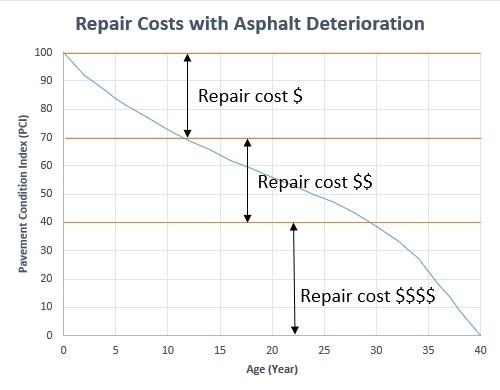
A thorough pavement management plan can save you from expensive, and sometimes unnecessary, repairs. The data can help you to narrow down the areas that require preventive maintenance and rehabilitation. An effective program will emphasize maintaining streets that are in good condition to extend their service life, as preventive maintenance is less costly than rehabilitation.
However, when streets have deteriorated and demand more extensive repair, your pavement management program allows you to plan for those projects and minimize the risks of having to make extensive changes to the project. By successfully implementing a pavement management program, you can improve the overall performance and life of your roads, saving the city and taxpayers time and money.
Sheue Torng Lee started her career at MnDOT in the MnROAD section after graduation, where she was involved in research data analysis as well as helping MnROAD in developing technical report documents. Sheue works in pavement/asset management and pavement preventative maintenance, emphasizing in pavement design and forensics.
As the world continues to evolve through the advancement of technology, new opportunities and challenges arise that you may, or may not, know the best way to tackle. Staying abreast of new systems and solutions can be a daunting, even overwhelming, task.
At WSB, we use Geographic Information Systems (GIS) to improve the way organizations acquire, understand and use their data. A successful GIS program employs geospatial technology to improve the quality of services, positively impact the decision-making of a community, become a central location for all data and improve overall workflow. To help simplify it for you, we will share some of the most common issues that we encounter and provide some advice on how to handle them.
Unable to retrieve data quickly enough
A properly designed and managed GIS will allow you access to all your organizations information at the touch of a button. Through field to office integration software, your team can enter field data directly from the site of the work and make the data immediately available to you. If you need to be able to verify a critical utility repair in order to calm concerned residents, your team can document the nature of the problem, how and when it was repaired, and include supporting photos or documents.
Unable to locate needed documents
It is time to go paperless. There is no need to continue to store paper documents in your office. They take up unnecessary space, get disorganized and go missing. Have you ever needed to find an as-built in order to verify the location of utility lines and been unable to find the final version? Using a GIS will allow you to convert all your supporting documents into digital files, tag them to any relevant accounts or locations for easy retrieval, and support a greener way of conducting business.
My data is outdated
Using ledgers and spreadsheets to manage your data quickly becomes tedious, time consuming and inefficient. If your system for tracking data involves any of these methods, it is likely current data has not been entered more than once. Imagine you need to share results of a lift station’s most recent inspection, but the most current document you can find is 3 years old. This could create a serious problem if you are unable to provide accurate findings. To ensure your group is working with the most accurate data available, a GIS is an easy and organized way to allow anyone the ability to enter information, keep it all stored in one central location, and control access to sensitive data.
My team is not able to work together efficiently
Do you have people working from more than one location? Do you often find you are emailing the same spreadsheet to multiple people to add data? There must be a more efficient way for your team to work together, right? A GIS can allow everyone on your team the ability to access, edit, and report from your groups database without wondering which version is the most up to date. It can save you time and frustration, allowing your group to spend their valuable time on other projects.
Our GIS group has worked with many clients to find solutions to their data problems. If you find yourself wondering if there might be a better way, please contact us. We will help to determine which of our complimentary, introductory services can improve how your organization works.
Justin leads the GIS Solutions Team. He is an accomplished Solutions Architect with a broad subject matter and technical experience in enterprise GIS and asset management technology. Justin has over 12 years of experience in the GIS field and holds a Master of Geographic Information Science degree from the University of Minnesota.