App-based storm water asset management program helps streamline inspections.
By Bill Alms, Project Manager, WSB
Changing permit requirements throughout the country for municipal separate storm sewer systems (MS4) prompted Minneapolis-based design and consulting firm WSB to develop a web-based application for tracking inspection and maintenance of storm water best management practices (BMPs). Launched in 2013, the application has helped dozens of communities meet National Pollutant Discharge Elimination System (NPDES) permit requirements and prioritize maintenance needs for aging storm water infrastructure.
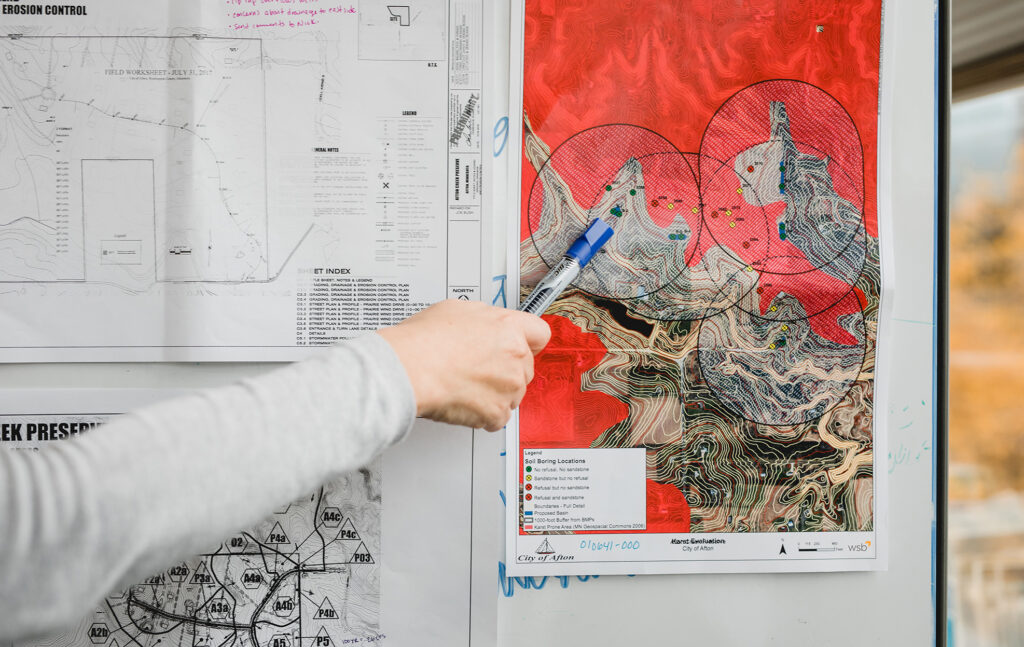
When the Minnesota Pollution Control Agency (MPCA) first introduced a new MS4 permit that required operators to have a standard procedure for annual inspections and maintenance, many communities felt overwhelmed. “We were hearing from municipal clients that there just wasn’t a good practice in place for wrapping your head around these systems,” said Jake Newhall, a water resources project manager at WSB. “Some systems have upward of 1,000 ponds and other BMPs. Communities didn’t have the resources available to inspect every asset.”
Utilizing Geographic Information System (GIS) data, the team at WSB developed an application to prioritize annual storm water BMP inspection and maintenance activities called the Storm Water Asset Management Program, or SWAMP. Specifically, the app provides an easily accessible BMP inventory, tracks and prioritizes annual inspections and maintenance and addresses the NPDES annual reporting requirement.
Nationally, the list of impaired waters steadily grows. In Minnesota alone, the MPCA recently added more than 500 waterbodies to the list. The app can be used to track the BMPs’ performance toward water quality improvements upstream of impaired waters, as well as performance related to Total Max Daily Load (TMDL) waste load allocations.
The web-based application utilizes a series of inputs that allow communities to customize their storm water maintenance programs. Since it was developed, national and local MS4 permitting requirements have continued to change. The program easily adapts to help clients meet these new standards, such as a recent requirement for reporting total suspended solids and total phosphorous.
Most communities have readily available data to utilize the program: a pond inventory, subwatershed and storm sewer maps and historic survey information. The result is a user-friendly snapshot of a community’s storm water system maintenance needs, which can be used to help decision-making as well as respond to staff, elected officials and residents.
How the program works:
- Data collection and application set-up: WSB begins the process by inputting data on all construction as-builts, MS4 ponds, drainage areas, land use maps, field inspection reports, storm sewer maps and BMPs. This data serves as the foundation of the client’s storm water asset management program.
- Prioritization: Once the data is compiled, the application analyzes BMPs and prioritizes them based on pollutant removal efficiencies, cost-benefit, downstream receiving water, etc.
- Surveying: Once the priorities are identified, surveying begins. The highest priority BMPs are surveyed to determine if there are maintenance needs. Following the survey, SWAMP is updated to reflect survey information and further calibrate the application.
- Budgeting: Once a SWAMP action plan is created, a budget can be made. Storm water inspection and maintenance activities can be budgeted based on the community’s capital improvement plan (CIP), making funds readily available for improvements as needed.
- Construction: With the action plan and budget identified through the app, municipalities can begin hiring contractors or allocating staff to perform construction and maintenance.
- Updates and tracking: The SWAMP application is updated to reflect the maintenance performed as well as track all historical activities.
WSB meets with multiple communities annually to review their programs and determine upcoming survey and maintenance needs. Prior to the app, clients would have to invest significant dollars in studies and models to prioritize storm water infrastructure needs. By utilizing the information within SWAMP, each client can efficiently prioritize BMP maintenance based on their preferred metrics, such as total cost, cost effectiveness and pollution removal effectiveness.
Many clients report that the program makes it easier to upgrade and maintain their BMPs. The SWAMP action plans for each community also make it easier for staff to address citizen concerns. If a resident wants to know when a pond will be maintained, the staff member or official can point to the framework and showcase how the priority of that pond compares to other assets within the system and when it will be due for maintenance.
“For developed communities, many of these BMPs that were installed in the 70s and 80s after the Clean Water Act are nearing their life expectancy,” said Newhall. “These are assets for the community–reducing pollution and ensuring safe, clean water–and we need to manage the benefits provided by this infrastructure in perpetuity.”
This article was originally published in the February 2020 issue of Storm Water Solutions magazine.