ArcGIS Online connects maps, apps, data and people so you can make smarter, faster decisions. It gives everyone – both inside and outside organizations – the ability to discover, use, make and share maps from any device at any time. At its core, ArcGIS Online is a hosted cloud software as a service (SaaS) platform. Everything you need to create your own web maps and apps is available on ArcGIS Online. You can create maps from Microsoft Excel or upload your data from ArcMap to share your map and collect data in the field on your tablet or phone.
ArcGIS Online supports many users collecting data in the field at one time. This presents a problem for large workforces, as you may need to track where your collectors go when working in the field. Using Esri’s Collector for ArcGIS app, you can have it periodically report the location of data collectors back to a tracking layer on ArcGIS Online by publishing a tracking layer on ArcGIS Online and adding it to an Web Map with tracking enabled. When this Web Map is accessed within the collector app, the collector app sends its GPS location back to the tracking layer hosted on ArcGIS Online at a predefined interval.
At WSB, we view ArcGIS Online as a technology that:
Can quickly be deployed for multiple uses
Is flexible enough to handle diverse workflows without requiring any programming
Has untapped potential for public outreach
Below is one of our favorite examples of how we used ArcGIS Online to help a client deliver immediate value to both the organization and the public.
Tracking Santa
For more than 25 years, firefighters in the City of St. Anthony, Minnesota, have helped Santa by collecting gifts for those in need. Santa rides in fire trucks throughout the city collecting gift donations from residents. In 2014, the city wanted to allow residents to track Santa’s location along his route.
The City of St. Anthony decided to utilize ArcGIS Online to track Santa, thanks to all the app’s capabilities.
Here’s how we did it:
A tracking layer was published on ArcGIS Online.
The tracking layer was added to a Web Map configured with the city’s custom Esri base maps with tracking enabled.
The city deployed an iPad with the Esri Collector for ArcGIS app to ride along with Santa with the Web Map open on the fire truck.
A custom web app was built using our DataLink platform to show Santa’s most recent location.
As the fire truck drove along its route, the collector app was configured to report the truck’s location every 30 seconds back to ArcGIS Online. Residents used DataLink to view Santa’s current location in relation to their house so they knew when Santa was arriving.
Tracking Santa’s location is certainly a unique use of ArcGIS Online, but it shows how extensible the ArcGIS Online platform is. With just a few clicks, you can begin to track real-time locations of users who are using the collector app.
Calculating the area or percentage of impervious surfaces for a given spatial extent helps determine curve numbers, runoff rates, and pollutant loadings. Overlaying an impervious surface layer with drainage areas for a city can determine impervious percentage per drainage catchment. The issue is getting an impervious surface for a large enough area, for example a city or a Watershed Management Organization (WMO). Digitizing of an aerial can create impervious surfaces for small areas but is too time consuming on a large scale.
Fortunately, with the current availability of high-resolution Color-Infrared (CIR) aerial photography, there is a workaround that is far less time consuming. Since the reflectance of vegetation peaks in the near infrared, vegetation yields high returns on CIR photography. This can be used to generate a Normalized Difference Vegetation Index (NDVI). The NDVI is a ratio from the returns of near infrared and visible light, telling us how “alive” something is. A high NDVI ratio signifies healthy, growing, green vegetation, where a low NDVI ratio signifies something not living, say pavement or rooftops.
The typical NDVI value ranges from -1.0 to +1.0 (GIS software calculates a value from 0 to 200). In that range, there will be a cut-off point that separates vegetation from non-vegetation. The value is typically just above 0.0, but varies based on the CIR aerial photography being used. Classifying the NDVI surface into two groups from that cut-off point gives a result that shows the area of vegetation and non-vegetation. Since there is a very high correlation between areas of non-vegetation and impervious surfaces, this result shows what is impervious and what is pervious.
This method yields results that are about 90 percent accurate. First, the assumption is made that vegetation equals pervious surfaces, which is not always the case. A large area of open dirt is a good example. It is still pervious but shows up as impervious because it is not vegetation. Another issue is shadows cast by trees, houses, and other structures. Since shadows are blocking out the light return (both visible and near infrared), any shadow is interpreted as non-living and thus impervious, even though it may be a pervious surface.
Even with these minor disadvantages, the time saved is enormous. Instead of taking weeks to digitize all the impervious area within a city, this analysis can be completed in under an hour. It is necessary to perform quality control on the data and clean up any of the issues described above by reclassifying something as pervious to impervious or vice versa.
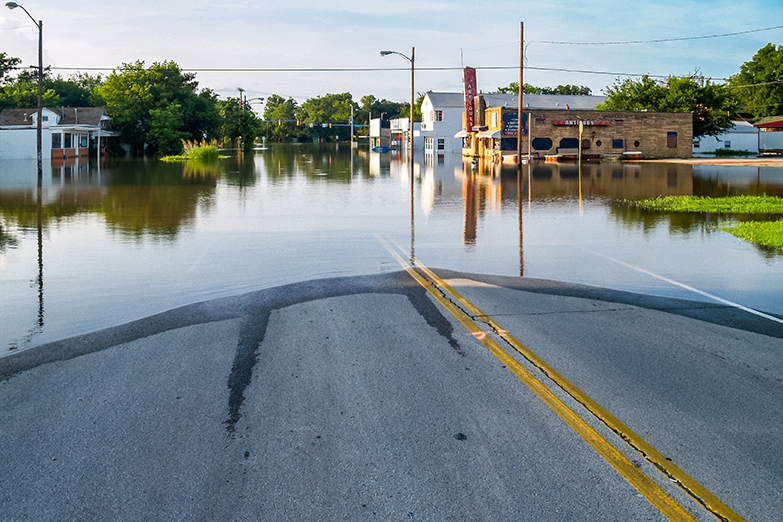
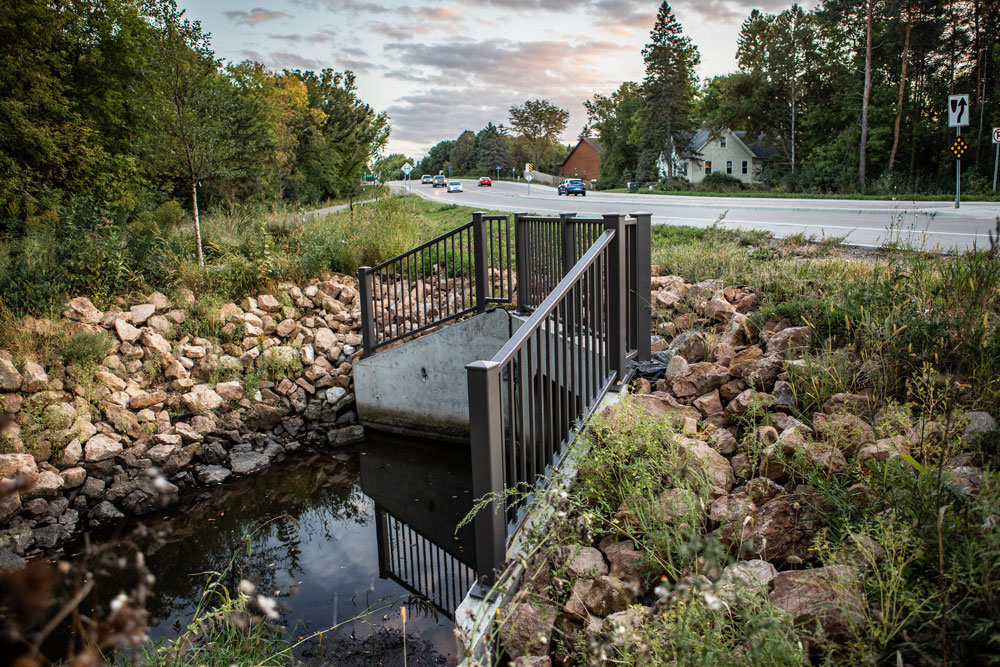
Over the years, both crack sealing and crack filling have proven to be very cost-effective tools in the preventive maintenance tool box. One area that has been overlooked when sealing streets and highways, however, has been the joints between two types of pavement – such as between an asphalt street and concrete curb or concrete pavement and the asphalt shoulder.
When a joint between two different pavements is left unsealed, water is unable to “jump the joint” and can end up saturating the underlying base materials and causing load-related failures. In areas where de-icing chemicals are used for snow removal operations, the flow of the residual brine can also cause the areas of infiltration to thaw earlier – increasing the likelihood of load-related damage during spring thaw.
Figure 1 – Asking Water to Jump Across a Joint
Where’s the proof that sealing these joints makes a difference in performance?
MnDOT recently did a study and published the Edge-Joint Sealing as a Preventive Maintenance Practice report, which showed that sealing the joint between concrete main line pavement and asphalt shoulders resulted in an 80% reduction in water infiltration. The assumption was that by keeping the base and sub-base drier, there would be better performance.
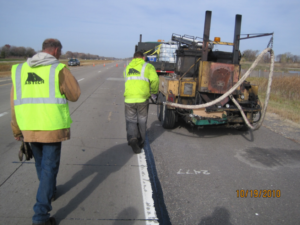
There are at least three methods of sealing the joints:
Rout and seal if the configuration of the joint will allow a router to be centered over it.
Clean and fill the joint if the concrete curbs have a pan that is too narrow to allow routing.
Apply a joint adhesive to the face of the concrete and pave the hot mix asphalt against it. Joint adhesive was developed specifically for application to cold paving joints to reduce water infiltration. It has a higher viscosity than a normal hot pour sealant, which allows a thicker layer to be applied to the face of the structure.
Figure 2 – Clean and Seal Joint
A best practices guide, called Recommended Performance Guidelines for Crack Treatment, can be found on the ISSA website.
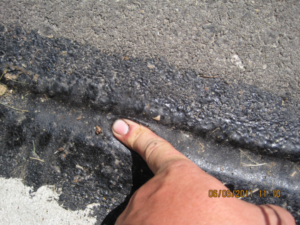
Figure 3 – Two-year-old Joint Adhesive
When sealing cracks in pavement, don’t forget about the joints along the curb line or between the shoulder and pavements.
Reference:
Minnesota Department of Transportation. Edge-Joint Sealing as a Preventive Maintenance Practice. August 2003. (MN/RC 2003-26).
We’re excited to officially launch the new branding of WSB. Sure, there’s a new logo, but it’s much more than that. It represents the sum of all things WSB – our work, our people, our process – as well as how we look and sound.
Since 1995, we’ve dedicated ourselves to the value of strong relationships, collaboration and forward-thinking ideas. We’ve inspired each other and been inspired by our clients to discover thoughtful and creative solutions that look beyond the needs of today to the opportunities of tomorrow. This rebranding is not a change in direction, but rather, an attempt to better define who we’ve always been and where we’re headed.
As we reflect on our past and anticipate our future, we’re thankful for our partners who have shared in our vision, passion and commitment.
Alison Harwood, Director of Natural Resources, WSB
Wetlands and other waters in Minnesota are regulated by a variety of agencies, including those at the federal, state, local or watershed level. Knowing who to contact and what type of approvals are needed is important and depends on the scope and location of the project.
Federal level
At the federal level, the U.S. Army Corps of Engineers (COE) regulates discharge of fill to waters of the U.S. and works within the channel of navigable waters as defined by Section 10 of the Rivers and Harbors Act. If work is proposed within a water of the U.S., a permit may be required through Section 404 of the Clean Water Act. Project impacts will fall into one of the following permit categories:
Regional General Permit (GP): These permits are issued for projects that impact less than 0.5 acres of wetland and authorize a specific list of impacts, or authorize work that is regulated and approved by the Minnesota Department of Natural Resources (DNR) through the Public Waters program. It typically takes three to four months to obtain this permit. In Minnesota, approval with a GP automatically includes EPA/MPCA Section 401 Certification.
Letter of Permission (LOP): These permits are issued for projects that impact wetlands between 0.5 to three acres (non-road projects) or 0.5 to five acres (road projects). COE performs an environmental assessment, taking four to 12 months to obtain this permit. In Minnesota, this approval automatically includes EPA/MPCA Section 401 Certification.
Individual Permit (IP): These permits are issued for projects that exceed the thresholds for the GP and LOP. COE performs an environmental assessment, taking anywhere from nine months to two years to obtain this permit. EPA/MPCA Section 401 Certification must be obtained separately.
If work is proposed below the OHW of a public water, a Public Waters Work permit will be required, which typically takes 60 to 90 days to obtain. It can take longer to obtain the permit depending on the complexity of the project. The DNR also issues permits for other types of work within public waters, including docks, crossings, dewatering, dredging, and boat launches.
The objective of the WCA is to obtain no net loss of wetlands within the state. The rule is administered at the local level by a local government unit (e.g., the city, county, watershed district, or soil and water conservation district.
If a project will impact a wetland, an approval through the Wetland Conservation Act is likely necessary. There are several types of approvals that may apply to the project:
No loss: Indicates that the wetland will not be impacted by the project (e.g., temporary impacts, impacts to incidental wetland).
Exemptions: Various exemptions exist for projects that are required to maintain public health and safety but also may result in minor wetland impacts.
De minimis: Allows a minimal amount of wetland impact to occur depending on the location of the wetland impact within the state.
Replacement plan: Allows wetland impacts to occur given that no other alternatives exist, impacts have been minimized to the extent practicable, and impacts will be mitigated (e.g., replaced).
Road bank replacement: Allows the state to replace for impacts to wetlands required due to the reconstruction of an existing serviceable public roadway to meet safety or design standards. This program is available to city, county, township, and other local road authorities. It is not available for Minnesota Department of Transportation projects.
To obtain any of the above permits, an applicant must provide project information that includes a project purpose and need, alternatives analysis, impact minimization measures, and a mitigation plan. Typically, mitigation is required at between a 1:1 to 2.5: 1 ratio.
Some watershed districts within the state also have regulatory authority over the waters within their watershed. Though each watershed district has their own specific rules, they typically cover impacts resulting from stormwater, erosion, dredging, wetland impacts, and floodplain fill. (Determine which watershed district a project is located within.)
What does this mean for a project?
If a project has the potential for water resource impacts, it is best to start coordinating with the applicable regulatory agencies as soon as possible (ideally a year in advance of construction). If you are unsure of whether your project will impact wetlands, begin by contacting your local WCA representative, Army Corps of Engineers regulatory department, and/or DNR Area Hydrologist.
LiDAR, which stands for Light Detection and Ranging, is a combination of “light” and “radar.” It’s a remote sensing technology that uses lasers to detect and measure features on the surface of the Earth. Due to its high accuracy, LiDAR has become the de facto standard for creating elevation surfaces and measuring heights of features above the ground such as trees or buildings.
LiDAR in action
Minnesota completed a statewide LiDAR gathering project funded by the Clean Water, Land and Legacy Amendment, and spearheaded by the Minnesota Department of Natural Resources and the Minnesota Geospatial Information Office. The six-year project resulted in a seamless, high-resolution digital elevation map of the entire State of Minnesota. This data is completely free to download and offers a vertical accuracy of six inches. This project has enabled the flow of accurate topographic information between all organizations and the general public.
LiDAR deliverables
The deliverables of the project came in different formats. The simplest and most frequently used format is two-foot contours that were generated statewide. There is also a high-resolution Digital Elevation Model (DEM) that can be acquired as county tiles. The user can generate contours at varying intervals in this format, such as one-foot or even six-inch. Both the contours and the DEM use bare earth returns, meaning you only get surface elevation.
A third format is the raw LiDAR data, which is dense collection of points, or a point cloud. If you imagine the laser from an airplane hitting the surface, it’s the information at that contact point that is reflected back to sensors on the plane. The density of those points depends on the exact collection methods, but typically there will be 2 million points per square mile, or approximately 20,000 points for a typical city block. The point cloud gives access to all the returns and not just the bare earth returns; therefore, we can gather information about the heights of trees, buildings, water towers, etc. The point cloud is so dense that it is even possible to extract overhead power lines from the data. These multiple returns allow the data to be used for many different 3D analyses and visualizations. Certain 3D software packages allow the user to take the point cloud and turn it on its side, creating a vertical profile with accurate object heights and ground elevations.
LiDAR uses
There are many uses for LiDAR data beyond viewing ground elevation or object heights. Any kind of hydrologic flow analysis can benefit from the use of this data. Erosion analysis can be done by using slope estimates from LiDAR to compute the amount of erosion in certain areas, and that in turn can be used to calculate sediment accumulations. LiDAR has also been used for flood modeling, urban planning, oil and gas exploration, and coastline management. With the wide availability of free and highly accurate topographic data, many are reaping the benefits of LiDAR data and finding that its uses are far-reaching across many disciplines.
The Great Lakes-Upper Mississippi River Board develops recommended standards for water works. These standards are followed by regulatory agencies in Minnesota and are used for the design of water systems.
Below is a summary of system design standards for distribution system piping and appurtenances:
Pressure:
The system should maintain a pressure of 20 psi at all points under all flow conditions.
Normal working pressure should be 60 to 80 psi, and no less than 35 psi.
Diameter:
Water mains that provide fire protection should be at least eight inches (8″) in diameter.
Water mains that do not provide fire protection should be at least three inches (3″) in diameter.
Fire protection:
Systems should be designed in accordance with State Insurance Office fire requirements.
Dead ends:
Dead ends should be minimized to reduce stagnant water, provide reliable service, and reduce head loss.
Dead ends should be equipped with a way to provide flushing at a rate of at least 2.5 feet per second in the pipe being flushed.
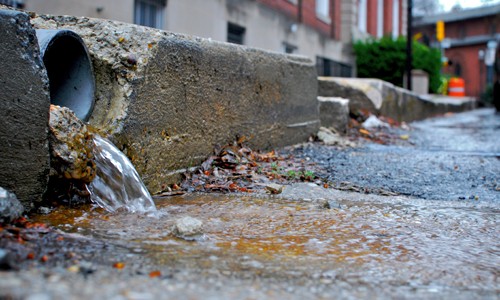
Stormwater is the water that flows over the ground after rain and snowmelt events. It runs off buildings, streets, sidewalks, and parking lots – anywhere it is prevented from naturally soaking into the ground.
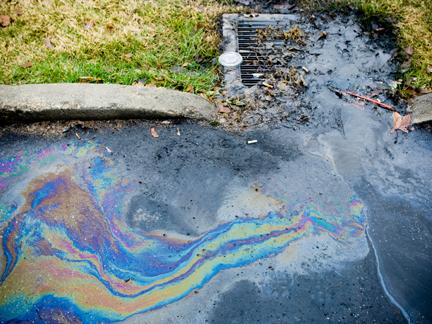
Stormwater can pick up debris, chemicals and dirt before it reaches its final destination. If not managed properly, stormwater can also contaminate streams, rivers and lakes; destroy aquatic habitats and kill aquatic plants, fish and animals; or even contaminate drinking water if it is polluted.
What can you do to prevent contamination?
Start implementing these practices today to protect our water and encourage your neighbors to do the same!
Use pesticides and fertilizers sparingly.
Properly dispose of products such as insecticides, pesticides, paints, and used motor oil. Do not pour these chemicals – or any other household products – into storm drains or onto the ground.
Sweep up litter and debris from sidewalks, driveways, and parking lots – especially around storm drains. Do not put anything into storm drains.
Clean up pet waste and dispose of it properly.
Don’t overwater your lawn.
Use a rain barrel or plant a rain garden.
Go to a car wash or wash your car on your lawn so that the water infiltrates into the ground.
Monumental advances in technology and data management over the past two decades coupled with a global increase in the urban area population have paved the way for integrating more technological networks into the built environment and public engagement processes. There is a demand for increased public accountability, constant access to real-time data, and a growing awareness of the need to develop cleaner and more cost-effective infrastructure systems. A Smart City systematically incorporates data and technology into existing frameworks to efficiently operate local systems, reduce costs, enhance quality of life, and invite more sharing of ideas.
Why a Smart City initiative?
Planners will play an important role in the future of Smart City development and are already facing important questions related to technology deployment, data collection, and overcoming technology access and equity concerns. The American Planning Association (APA) developed its Smart Cities and Sustainability Initiative to affirm the relevance of Smart City technology to the field of planning and to identify what critical technologies planners will need to pay attention to in the decades to come. The main goal was to gauge the knowledge and interest level of planning professionals in different aspects of Smart Cities and to make recommendations about how to support the interests of planning professionals going forward.
Overview of Smart Cities components
The concept of Smart Cities can seem intangible. The Smart Cities and Sustainability Initiative report gives a broad overview of the key components of Smart Cities and provides a framework for understanding and tying the concept to the planning profession.
Broadband network expansion – High-speed broadband networks will become a staple of Smart City technology. The definition of “high-speed” is continuously changing, and the demand for streaming services and cloud computing are pushing the limits of what is considered fast and reliable access. The FCC National Broadband Plan has a goal of delivering 100 mbps broadband to anchor public institutions like libraries, schools, and government centers by 2020.
Smart Cities will need to balance investments in both broadband and wireless network access to meet the needs of a diverse customer base.
Technology and data applications – Smart Cities require incorporating more data into existing systems. Smart Cities put data to greater use, which requires enhanced points of data collection integrated into infrastructure. The Smart City is adept at “collecting, communicating and crunching” data (Smart Cities and Sustainability Initiative, page 12), as well as using data to optimize systems and anticipating problems before they occur.
Sustainability, resiliency and energy – Much optimism surrounds the idea of using Smart City technologies to improve the energy efficiency of local and regional systems. Deploying “smart grids” will allow for automated and adaptable energy delivery systems. Green building technologies will help improve the energy efficiency of buildings, the single-largest carbon emissions source in the world. Planners can influence code and ordinance development to help usher in these changes in the built environment.
Equity and the digital divide – While Smart City technology has the potential to be transformative, the increasing role of technological services raises the important question of access and equity. The potential exists for certain populations to be systematically excluded or underserved by Smart City technology, including seniors, low-income families, minority households, and individuals without a college education (Smart Cities and Sustainability Initiative, page 14).
Governance and the planner’s role – Smart Cities implies an increasing reliance upon technological applications for public feedback and engagement. The hope is that increasing the access points for public engagement through technology will reach more people than traditional methods. Planners will need to use this technology in a transparent fashion and ensure that public trust is maintained.
Findings of the Smart City initiative: What is of most interest to planners?
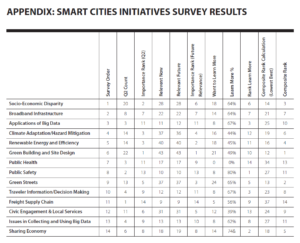
The APA Smart Cities Initiative Task Force incorporated a listening phase, which directed outreach to APA members through a survey including 14 different Smart City topics, asking participants to rank the importance of these topics, their interest and their desire to learn more about each topic. The listening phase also included an ideation tool online forum, and an innovation portal hosted by an APA-based LinkedIn portal.
Green building and site design, socio-economic disparity, and renewable energy and efficiency were ranked as the top three areas of importance by survey respondents. Public safety and freight supply were ranked as the least important. Interestingly, public safety also ranked as the subject area that most planners want to learn more about. The full list of topics and the results matrix is included here:
Photo Credit: Appendix (page 30) of APA’s Smart Cities and Sustainability Initiative report
Moving forward
The report concludes by observing that planners have an interest in Smart Cities, and recommends that APA develop strategic actions, including:
Centralize innovative information surrounding Smart Cities for use by planning professionals
Develop comprehensive plan Smart City guidelines
Partner with research entities to increase the body of knowledge on Smart City technologies
Utilize APA’s National Planning Conference as an opportunity to teach about technology
Work with AICP to train planners on integrating technology systems
Create a divisions council initiative for Smart Cities
Offer ethics training related to big data
Advocate for policies that bridge the digital divide
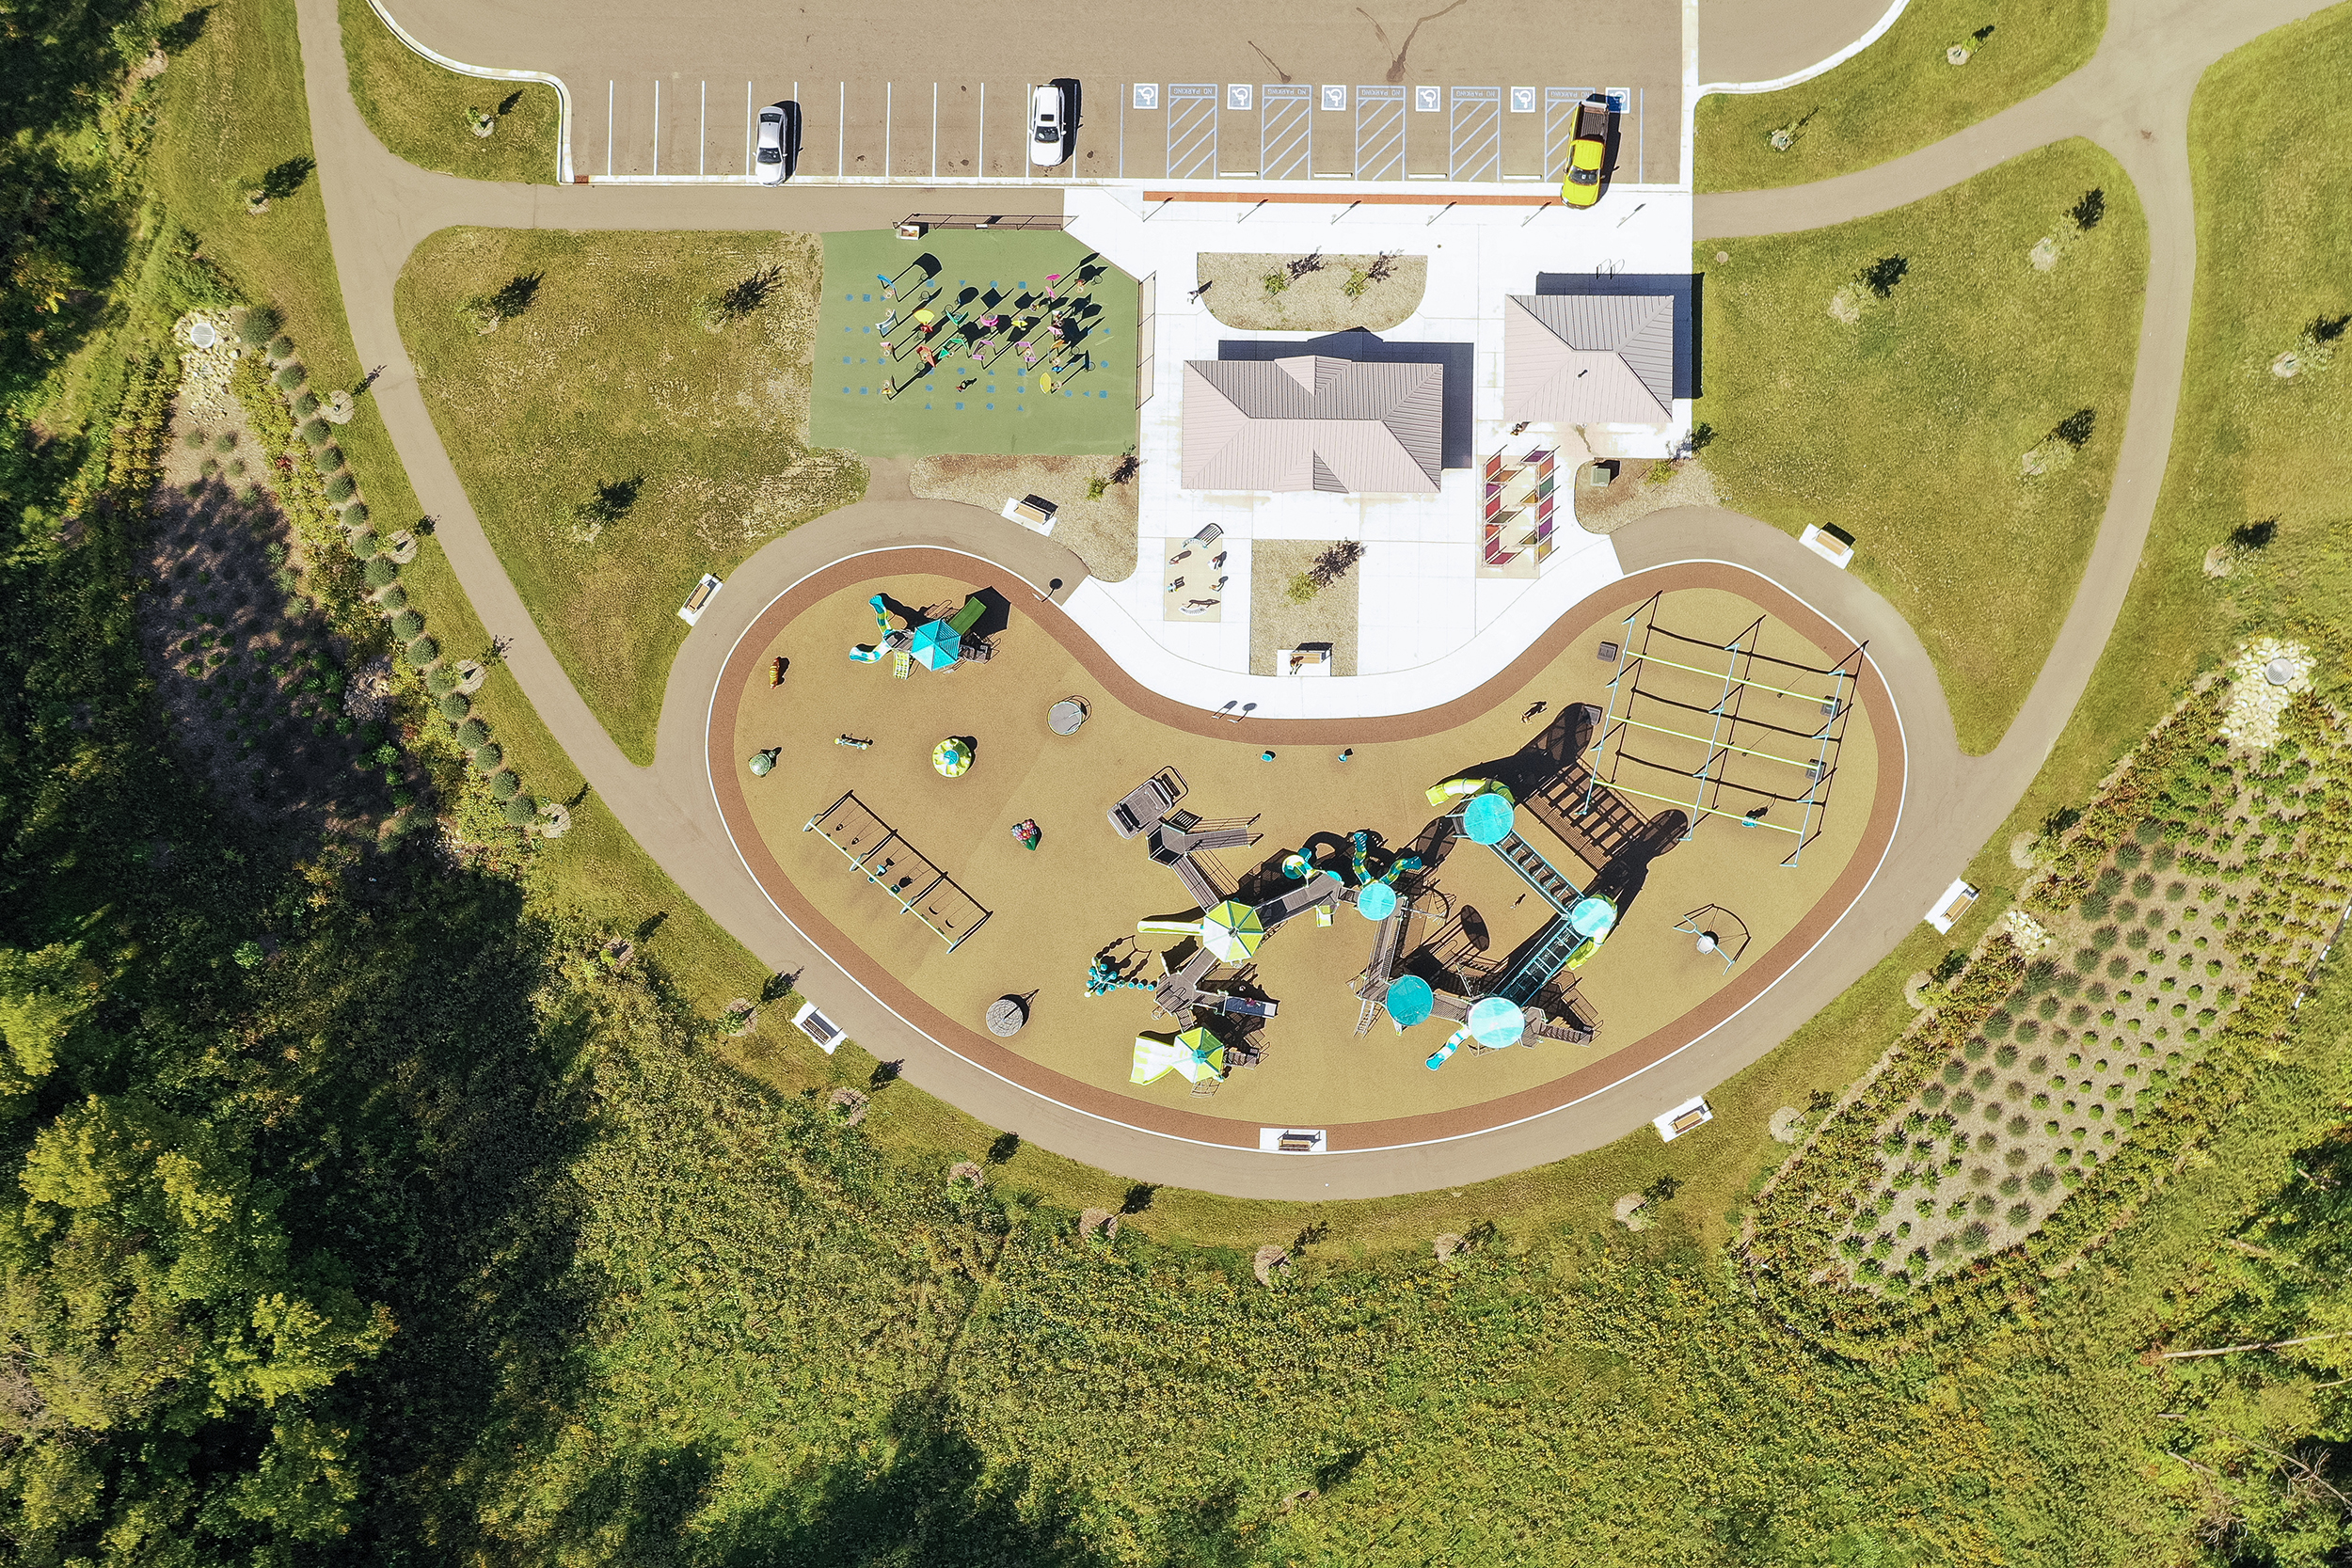
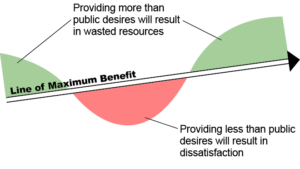
Quality of life in any community is dependent on that community’s character, physical environment, and personal living space. These can all be improved when a community includes parks, natural open spaces, trails, and recreational opportunities. The most successful approach to developing a park system plan – or any comprehensive planning project – is through a robust public engagement process. This will achieve the best understanding of constituent needs, resulting in local confidence that planning decisions align with and are relevant to the interests of the population being served. It is particularly important to engage the public when considering a referendum. The graphic below illustrations how a public engagement process can avoid wasted resources or community dissatisfaction.
Modern park system planning should be based on the specific needs of the community and citizens that the parks will serve. The process of developing and maintaining public space is costly and time intensive, and should be conducted through a thorough and transparent needs assessment and public process. This routinely involves hosting several input and review meetings with a wide variety of individuals, committees and stakeholders. Digital communications, social media, and other survey techniques may be effective ways to reach the right audiences.
The goal is ultimately to ensure that the findings and recommendations are a synthesis of the input from the residents, elected officials, city staff, and other community members. Following is a partial list of considerations that are typically explored when considering long-term improvements to a community’s park system.
• History of the system • Previous planning studies and reports • Demographics • Recreation trends • System-wide property and facility assessment • Public input/needs and desires of the community • Active/programmed recreation, as well as passive uses • Community image, tourism, and economic development • Trail network – internal and external connections • Natural resource management • Budget • Safety and accessibility • Flexibility of spaces to create a variety of experiences • Operations and maintenance


