Geospatial Data

Geospatial Data

January 11, 2023

The Foundation of Digital Delivery

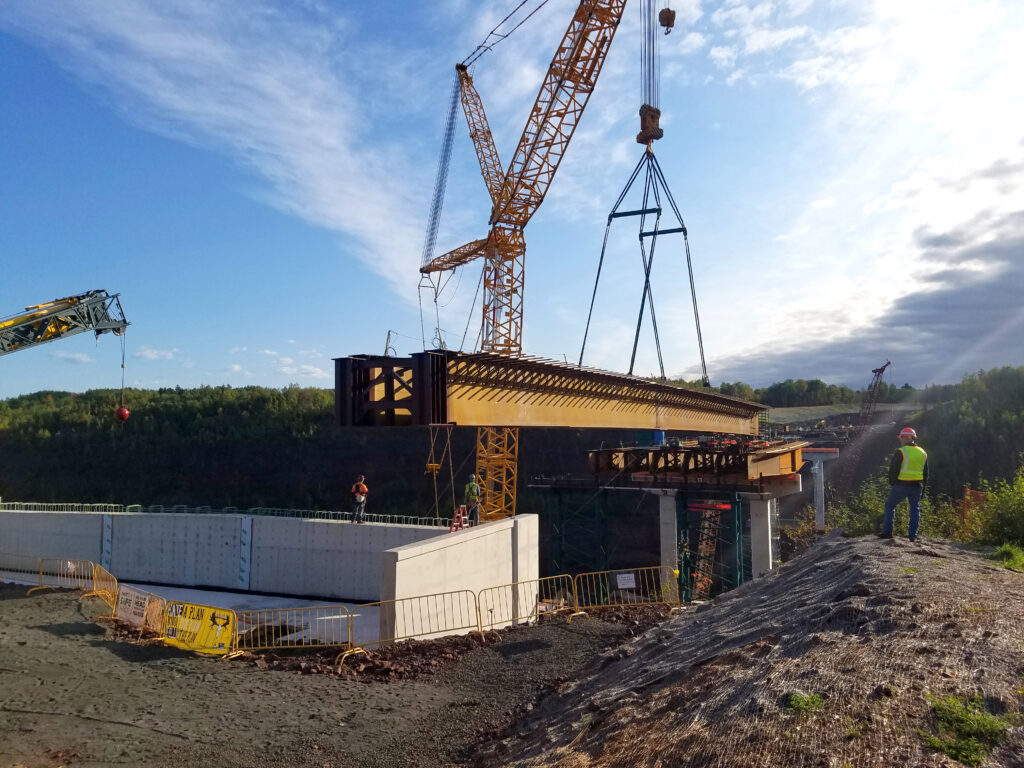
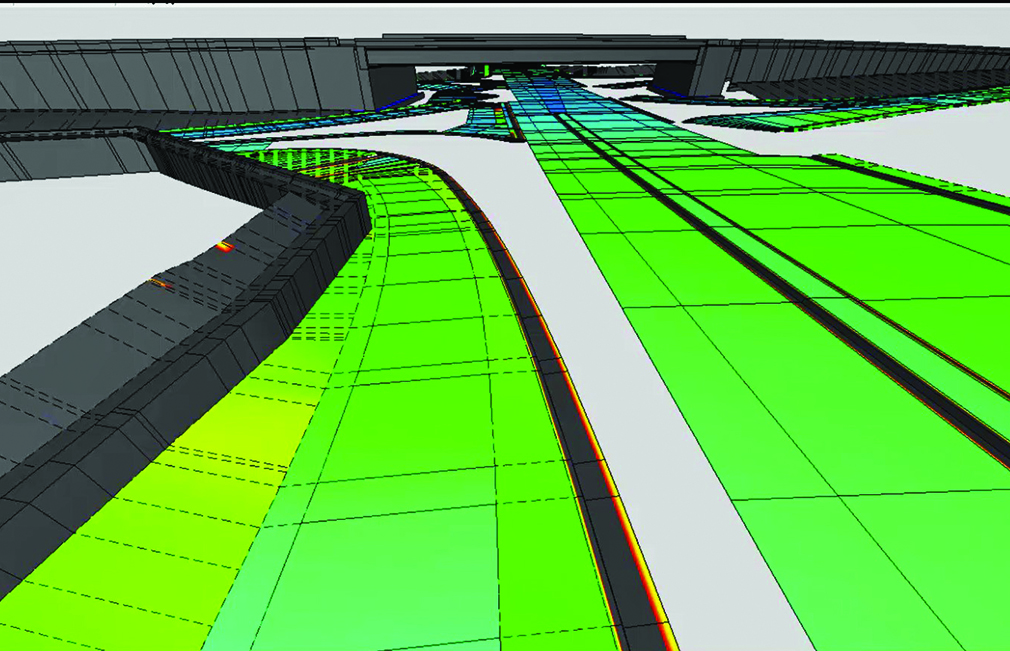
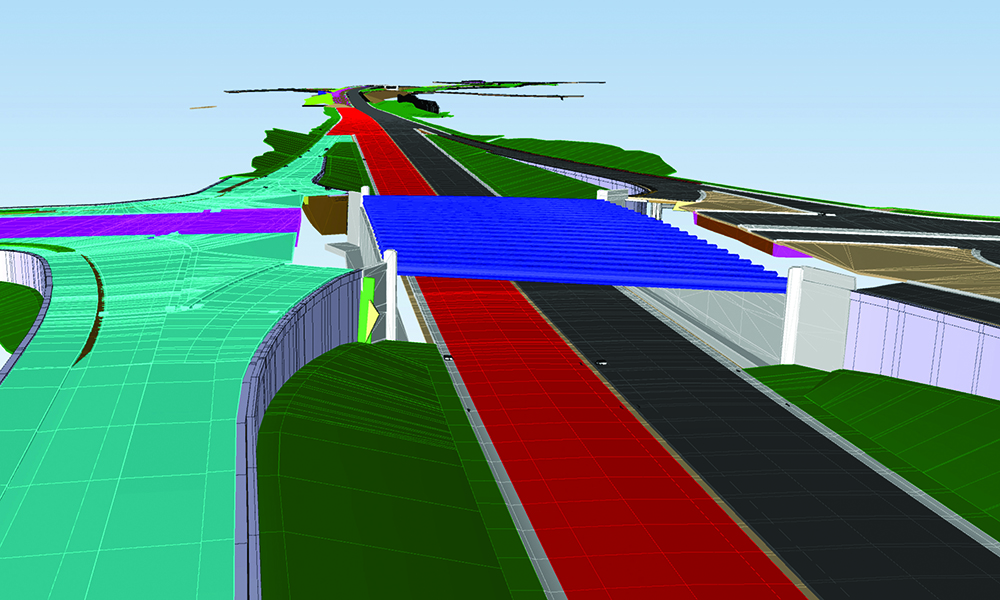
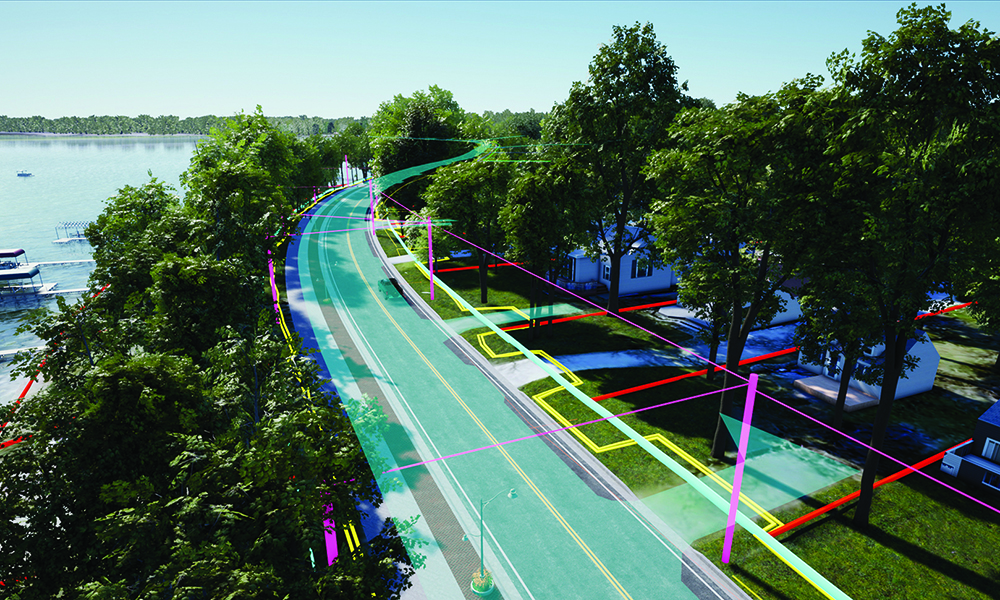
Geospatial data is information that involves large sets of data gathered from a variety of diverse sources based on location. In the Architecture, Engineering and Construction (AEC) Industry, we depend on geospatial data to build and design infrastructure. Strong data is the foundation of any digital delivery project. Capturing geospatial data for infrastructure projects is the first step in the digital delivery workflow.

The five ways we gather thousands of accurate data points to improve design methods and increase speed and accuracy.

Reality Capture for 4D / 5D

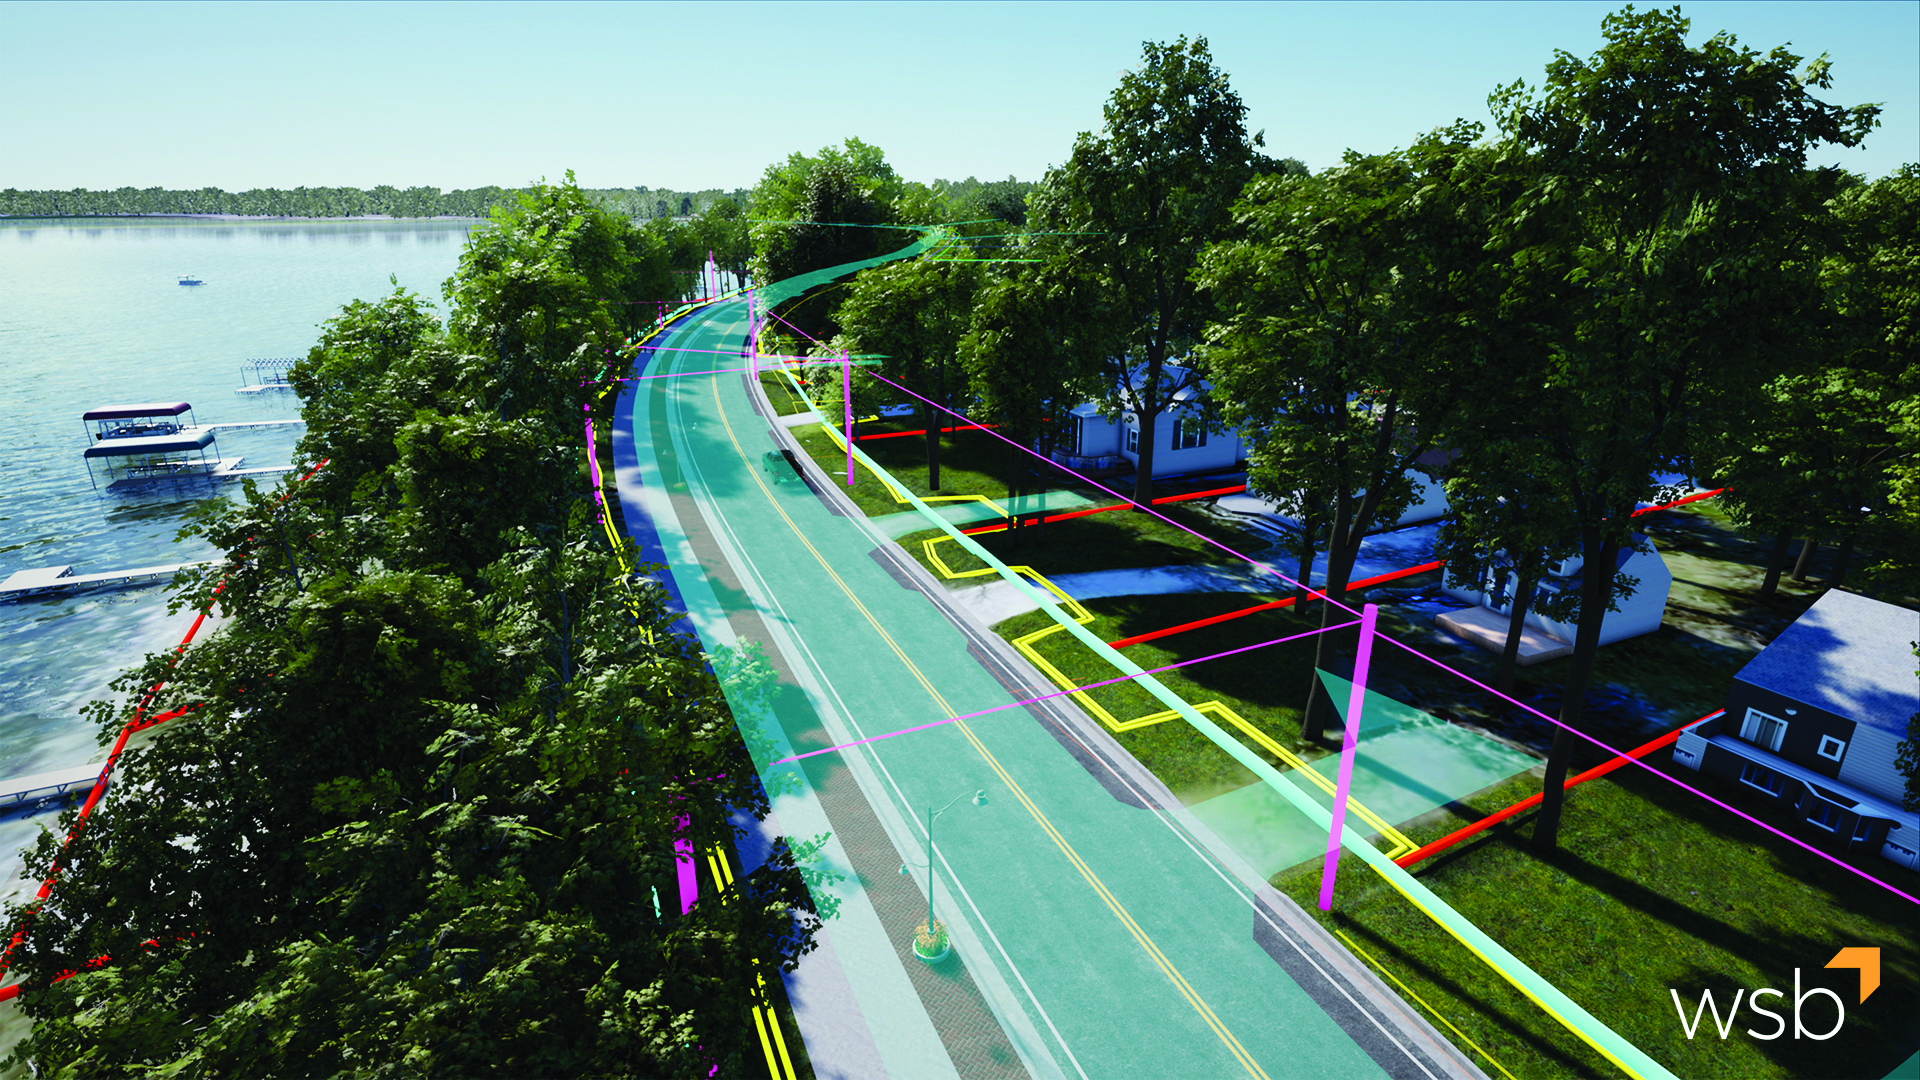
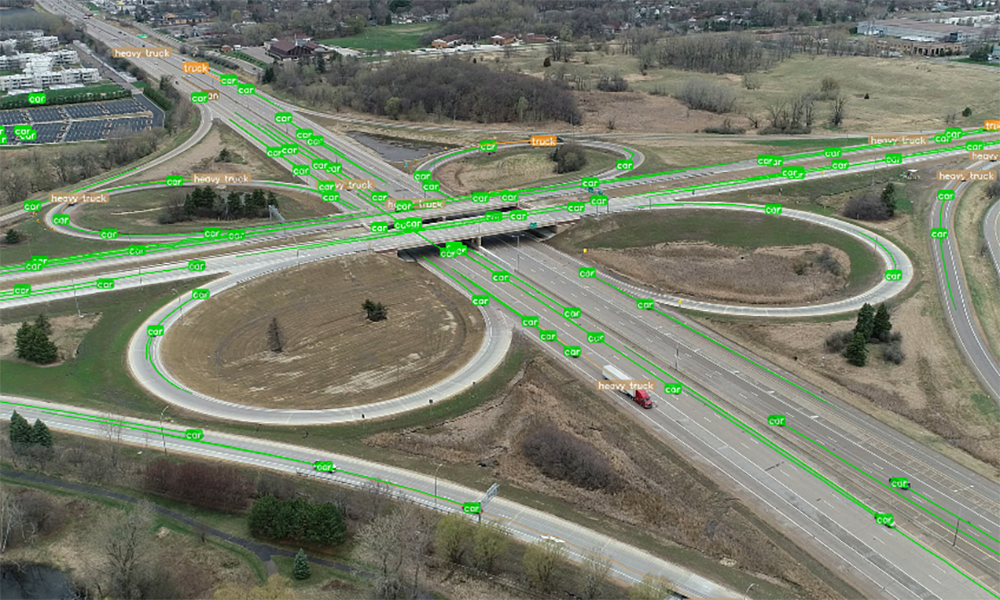
High resolution drones capture thousands of photos that overlap at different angles to create a geospatially accurate reality capture of an entire site. The reality capture contains accurate lengths, depths, and heights.  To increase accuracy, the geospatial data is tied to survey ground control points.  Once the data is processed, it can be input into many different design software, serving as the first step in digital delivery.

Interior/Indoor Scanning

Using a tripod and LIDAR scanner, we collect thousands of data points. The scanner is moved around to cover the entire area, capturing points along the way, and is then uploaded into BIM software. This information can be used to create a robust asset management system.

WSB 360 – Google Street View

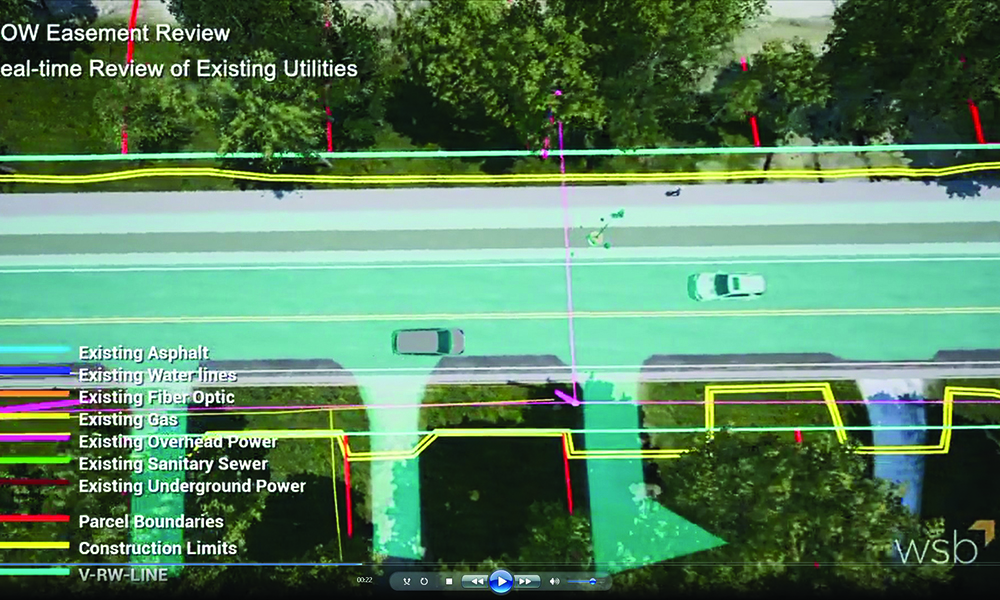
WSB 360º captures high-resolution 360º imagery that is used to detect and map a variety of assets as they exist today. Google imagery is often missing or out-of-date. By driving a street or an alley, data is gathered within minutes and uploaded to Google Maps and StreetView.  This technology is also used to capture, map, and classify road assets including hydrants, signs, power poles, and streetlights.

Traditional Surveying

Traditional surveying is performed by survey crews using tools to make measurements. Some refer to this as the most accurate form of data collection because of the boots on the ground element. There are proven methods of verifying accuracy and conventional survey has been performed for hundreds of years.

Conventional Drone | 2D & 3D Reality Captures

With conventional drone data, we create 2D and 3D high-resolution imagery. This data serves as the foundation for 3D and 2D reality captures. 3D reality captures are developed when elevations are needed for digital design. 2D reality captures are developed when elevation isn’t necessary. In the past, satellite imagery was relied upon, which was often inaccurate and outdated. Through conventional drones, we can document a site accurately, in-depth, and within minutes.

3D design

Our Approach to Digital Delivery

Introducing Digital Plus

The future of project delivery

Beyond paperless

For many years, the AEC industry has been embracing advancements in the way we deliver projects.  Paperless plans were the first step in this process. Fast forwarding to today, paperless plans have evolved one step further. People often refer to any digital plan set as paperless, but at WSB, we take our designs one step beyond paperless by creating 100% models. 100% models mean the entire project is created and designed in 3D.

100% models house data and design information from the entire project lifecycle, leaving owners and contractors with an accurate, detailed, data-based model to support asset management needs well into the future.

The development of DigitalPlus

WSB is committed to leading our industry in the use of cutting-edge tools to work smarter.  As a firm, we’ve been at the leading edge of digital delivery efforts for many years.  Our approach is unique and one that has been internationally recognized as a best practice in digital project delivery.  To help tell this story, we created DigitalPlus. 

DigitalPlus is the future of digital delivery. Through a combination of cutting-edge tools, expertise and a commitment to innovation, we are shaping the way our industry delivers projects. We believe in advanced project delivery, and we know how to apply the right technology and expertise to support our infrastructure needs. Through DigitalPlus, we are setting new standards, developing best practices and changing our industry’s approach to multidimensional digital design.

Why DigitalPlus

As engineers, we are motivated by the opportunities to design infrastructure projects that support our communities. The infrastructure around us has a significant impact on our daily lives. From drafting plan sets to public meetings, we live in the details and embrace the full process.  We also embrace the advancements in our industry and how we can leverage technology to deliver better projects for our clients.


The benefits

  • Improve Quality
  • Sustainability
  • Enhanced Scheduling
  • Better Managed Risk
  • Relationship Management (Contractors | Owners)
  • Improve Cost
  • Increase Collaboration and Communication

What is DigitalPlus

A combination of expertise and cutting-edge tools.

Data Collection

Data is the foundation of any good project. We use several traditional data collection methods to gather data points that help paint a picture of the world around us. Good data is vital to the DigitalPlus process.

3D Design

Designing in 3D allows us to develop the project while providing a complete and accurate picture of the final product, significantly improving project outcomes.

4D / 5D

4D/5D modeling improves accuracy and efficiency by adding time and cost functions into design. The true power lies in the way a model can be used during preliminary design, final design and throughout construction.

Asset Management

Asset Management is the collection of an agency’s infrastructure assets and includes a plan for managing assets over the infrastructure’s lifespan. Through digital twins, assets can be managed virtually and accurately.

Utility Coordination

Digital delivery aids utility coordination by translating utility information into a 3D environment that can be compared with the design to identity and mitigate conflicts.

Visualization

Real-time 3D visualization has completely transformed site-specific review and public engagement efforts. Visualizations allow for active participation regardless of project scope and size.

Traffic Operations

Through simulation technology and trip-origin destination data, roadway designs are now guided by real-time and historical mobility movement data.

Integrated Project Delivery

A process, rather than a project that all starts with an idea. Through a combination of expertise and cutting-edge tools, land developers and owners identify opportunities and challenges before a project begins.

Machine Control Modeling

Using 3D models and GPS data, machine control modeling allows earthwork machinery to be accurately positioned. Design surfaces, grades and alignments are directly imported into construction equipment, resulting in increased accuracy and timelines.


To learn more, visit: www.wsbdigitalplus.com

Every Project Should Use Active Visualization

By Jeff Christiansen, Visualization Studio Manager, WSB

What does the popular online video game Fortnite and WSB have in common? Active 3D visualization.

Visualization is the process of building a model of a project site that can aid in the iterative design process and construction of a project. The technology has been used for decades and can be categorized as passive or active.

Passive visualizations are 3D visualizations that have been created from individually rendered frames and cannot be updated in real time. The supplemental tools to work on a passive visualization are filters and photoshop. The process of designing a project through passive visualization is inefficient and expensive. That’s why, in 2017, the technologically advanced engineering firms, including WSB, moved towards active visualization. Active visualizations allow us to produce project renderings in real time and make edits to those renderings in seconds. The software engine and graphics cards we use to create active or real-time visualizations at WSB are the same technology used for developing industry leading games.

Active visualizations can be used to create renderings on several different project types. From landscaping to transportation, any project with a design phase can take advantage of the state-of-the-art technology. This is important because active visualization can offer several benefits including realism, flexibility and certainty.

Realism

Until active visualization software was created for Fortnite, the engineering industry relied on passive visualizations and its tools. The visualizations looked fine but were not realistic. Consider a municipal client who may be interested in rebuilding three blocks of their downtown. Within an active visualization, a client can pick a place anywhere in the three-block radius and “walk” through the town with the use of only a computer and a mouse or keyboard. They can see the color of the buildings, the species of the trees and flowers planted alongside the sidewalks and even review the various concrete dyes within the scene, all within real-time, and all while changing the time of day to review color hues.

Flexibility

A client gets a clear picture of what those new three city blocks will look like because of the realism of the designs and that influences flexibility. Active visualization is flexible because the software allows a designer to make changes in seconds. For example, if a client did not like the color of the buildings in the rendering, a designer can change it in real time. This is great for trying new and different ideas. It can also help a client save money by making clear decisions about other design elements before ordering materials such as light poles, wayfinding signage, flowers and trees or other design elements.

Certainty

Active visualization allows a client to make quicker decisions in a design so they are certain they will be happy with the result. The certainty for the client also helps build trust during public engagement processes. The realism and flexibility of the renderings lead to less interpretation by a viewer, whether they are a client or community member.

Active visualization has become the standard at WSB for municipal and landscape architecture projects and will no doubt start to be used for other projects soon. The benefits of realism, flexibility and certainty help ensure each project is delivered on time, on budget and at the highest quality.

Jeff is a visualization studio manager with more than 22 years experience on many types of visualization projects, including over 400 miles of roadway with design elements that include five-level interchanges, bridge aesthetics, and complex roundabouts. He is an experienced project manager in the development and final production of disparate visualizations for municipal, state, and federal projects.

[email protected] | 214.789.0538

COVID-19 Testing & Vaccination Assistance

By Andi Moffatt, Vice President of Environmental Services, WSB

As the COVID-19 pandemic began to spread through the country, WSB was called on by the Minnesota State Emergency Operations Center (SEOC) to assist in COVID-19 testing logistics. As project managers in the AEC industry, our team is used to working under pressure – and this task was no exception. We welcomed the chance to assist the state in testing Minnesotans and to do our part in preventing the spread of COVID-19.

A LARGE EFFORT THAT SPANNED ACROSS THE STATE.

The size and scale of this project was enormous. Representatives from the state, cities, counties, local public health organizations and staff at the vaccination and testing venues came together as a coalition to get this project off the ground and operational. To support these efforts, several WSB team members from across the company stepped in to assist on the emergency contract to set-up and manage the logistics of the state’s no barrier COVID-19 testing sites. We provided project management, IT, site mapping and drone photography, visual documentation and information gathering, and general logistics on behalf of the state.

GETTING MINNESOTANS VACCINATED.

As vaccines became available throughout the state, the SEOC asked WSB to manage the logistics associated with COVID-19 vaccine sites. We continue to work behind the scenes to help Minnesotans get vaccinated.

TACKLING CHALLENGES HEAD ON.

This project has been rewarding for many of us at WSB. It reinforces our commitment to supporting our communities and the challenges they face, no matter what they may be. Internally, we’ve also reminded ourselves that nothing is too big for us to tackle together and that we will work across departments, teams and offices to deliver for our clients.

“We are honored to have been able to play a role in such a dedicated, committed and passionate network across the state,” said Andi Moffatt, vice president of environmental services. “Public health is a priority, and we will continue to work with the state and our local communities to help deliver this critical support.”

Andi is a Vice President with more than 23 years of experience leading people and projects that include planning, environmental, energy, highway, natural resources, construction and development. She oversees our Environmental services and approaches her work with passion and positivity.

[email protected] | 763.287.7196

Unpacking the molecular structure of COVID-19 through visualizations

By Jeff Christiansen, Visualization Studio Manager, WSB

The molecular structure of COVID-19 is complicated. The ectodomain, also known as a surface protein, is complex. The 3D visualization focuses on just one of the surface protein complexes that protrude from the surface of the virus. All 21,539 atoms and 20,995 bonds visualized show how the attachment mechanism connects to the host cell. You’ve probably seen various generic models all over the news, but nothing compares to the actual molecular structure. Knowledge of this structure is helping researchers define and design proper pharmaceutical responses.

To create this visualization, data was pulled from the Worldwide Protein Data Bank. Developed using advanced visualization tools, expertise and software, the visualization is an accurate portrayal of COVID-19 that shows how complex the virus actually is.

Jeff is a visualization studio manager with more than 22 years of experience with many types of visualization projects, including over 400 miles of roadway with design elements that include five-level interchanges, bridge aesthetics, and complex roundabouts. He is an experienced project manager in the development and final production of disparate visualizations for municipal, state, and federal projects.

Jeff Christiansen [email protected] 214.789.0538

How visualizations are changing the engineering industry

Jeff Christiansen, WSB Visualization Studio Manager

In a technology-driven society, we are challenged to adapt and prepare for the changing technologies of tomorrow. As a Visualization Studio Manager, helping clients see the big picture and visualize completed projects drives curiosity and reveals the potential impacts of our work. Creating visualizations plays a crucial role in helping communities and clients evolve. In the past few years, visualization capabilities have changed rapidly, allowing renderings to be completed in minutes. To stay on top of this cutting-edge technology, we must understand the software and carve out new markets from existing industries.

New developments in ray tracing

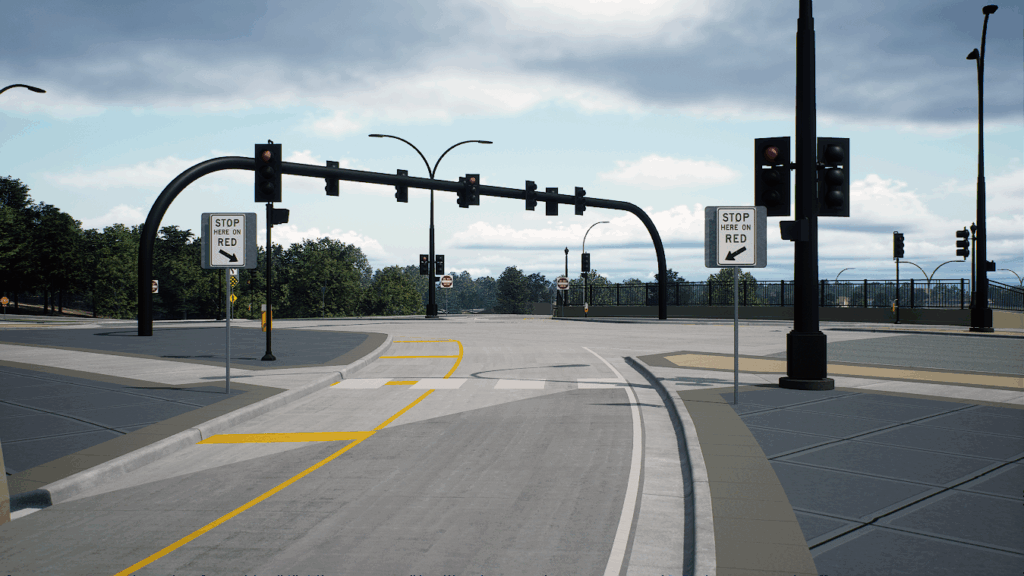
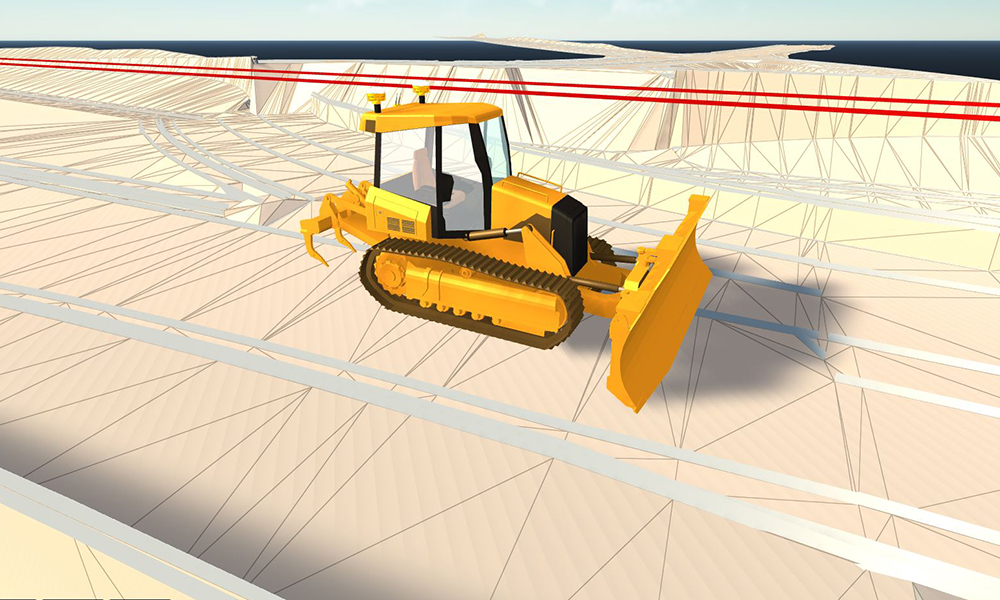
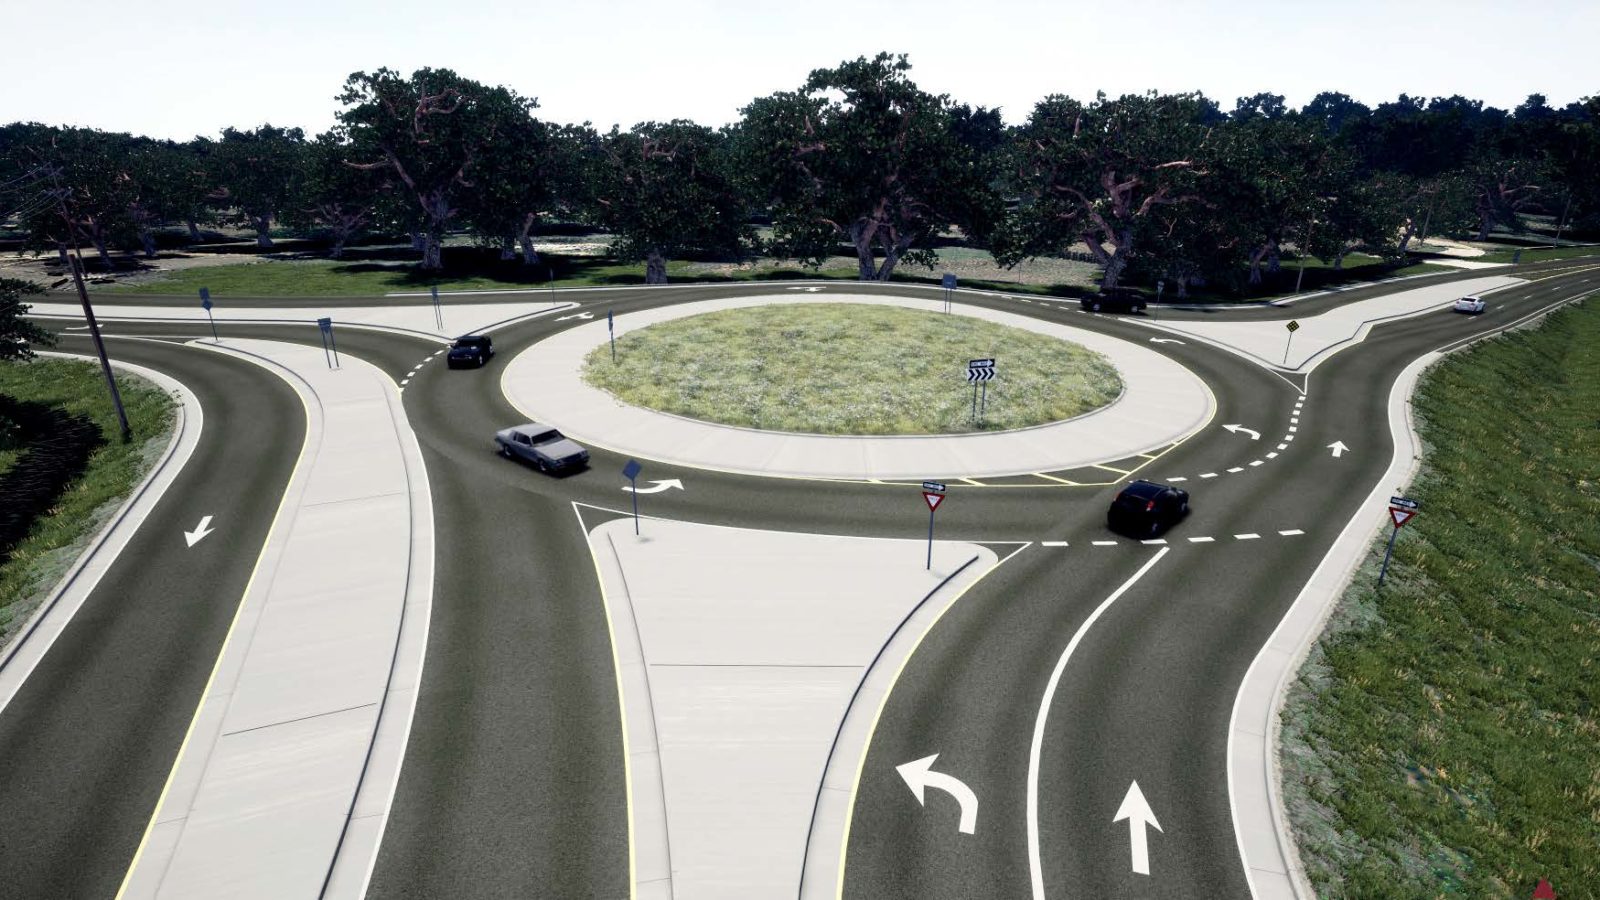
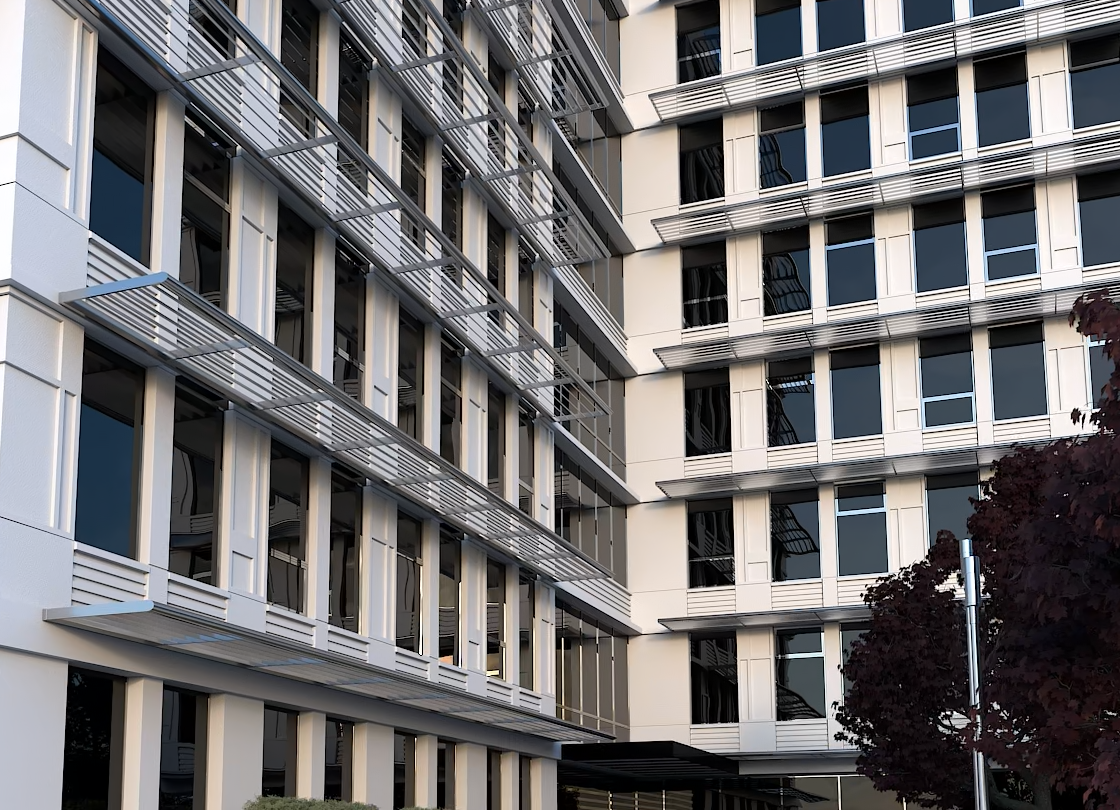
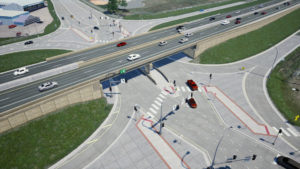
Up until last month, real-time and ray tracing couldn’t be used in the same sentence without a bank of 10 GPUs and 2500 watts of power. Ray tracing makes renderings dynamic and realistic and thanks to powerful GPUs, shortens the amount of time spent on each frame. This recent advance in technology allows clients and the public to see reflections, higher quality shadows and experience the creation for themselves. Today, we’re utilizing these technologies to create stunning visualizations for our clients. Once the projects have been modeled, iterations are produced in minutes, instead of days or weeks.

For some, classic visualization techniques and development are still the only way to produce the highest quality imagery when secondary shadows, complex caustics, and very high resolutions are required. In real-time, there is an abundance of data creating the visualizations of skyscrapers or roadways. In some cases, classic visualization allows an audience to see specific renderings that assist beyond the scope of just engineering. Ray tracing, augmented reality (AR), and virtual reality (VR) allow us to visualize how things work from transportation and infrastructure to medical devices and demonstrative evidence.

Applying AR and VR

Immersive technologies, both AR and VR, allow clients to become part of their projects months or years in advance. Specifics such as material schedules, lighting, and species-specific landscaping create a three-dimensional rendered experience for people to become immersed in before it becomes a reality. From using VR to drive through a road design or using AR to see a properly placed medical device from any angle, visualizations reveal findings in a way anyone can understand. These technologies provide an unparalleled tool to investigate or market the feasibility and accuracy of a product or service.


Jeff is a visualization studio manager with more than 22 years of experience with many types of visualization projects, including over 400 miles of roadway with design elements that include five-level interchanges, bridge aesthetics, and complex roundabouts. He is an experienced project manager in the development and final production of disparate visualizations for municipal, state, and federal projects.