
As someone who has been on both the regulator and applicant side of the table, I understand that wetland permitting can seem like a complicated task, involving multiple review agencies and months of careful planning. I’ve witnessed frustrated project developers after growing impatient with the process, and concerned regulators who feared the appropriate steps to minimize impacts were not taken. However, if anticipated correctly, the permitting process can be smooth and painless.
As we approach growing season, it is helpful to understand the project development steps for areas that feature wetlands – even if you don’t expect to impact them.
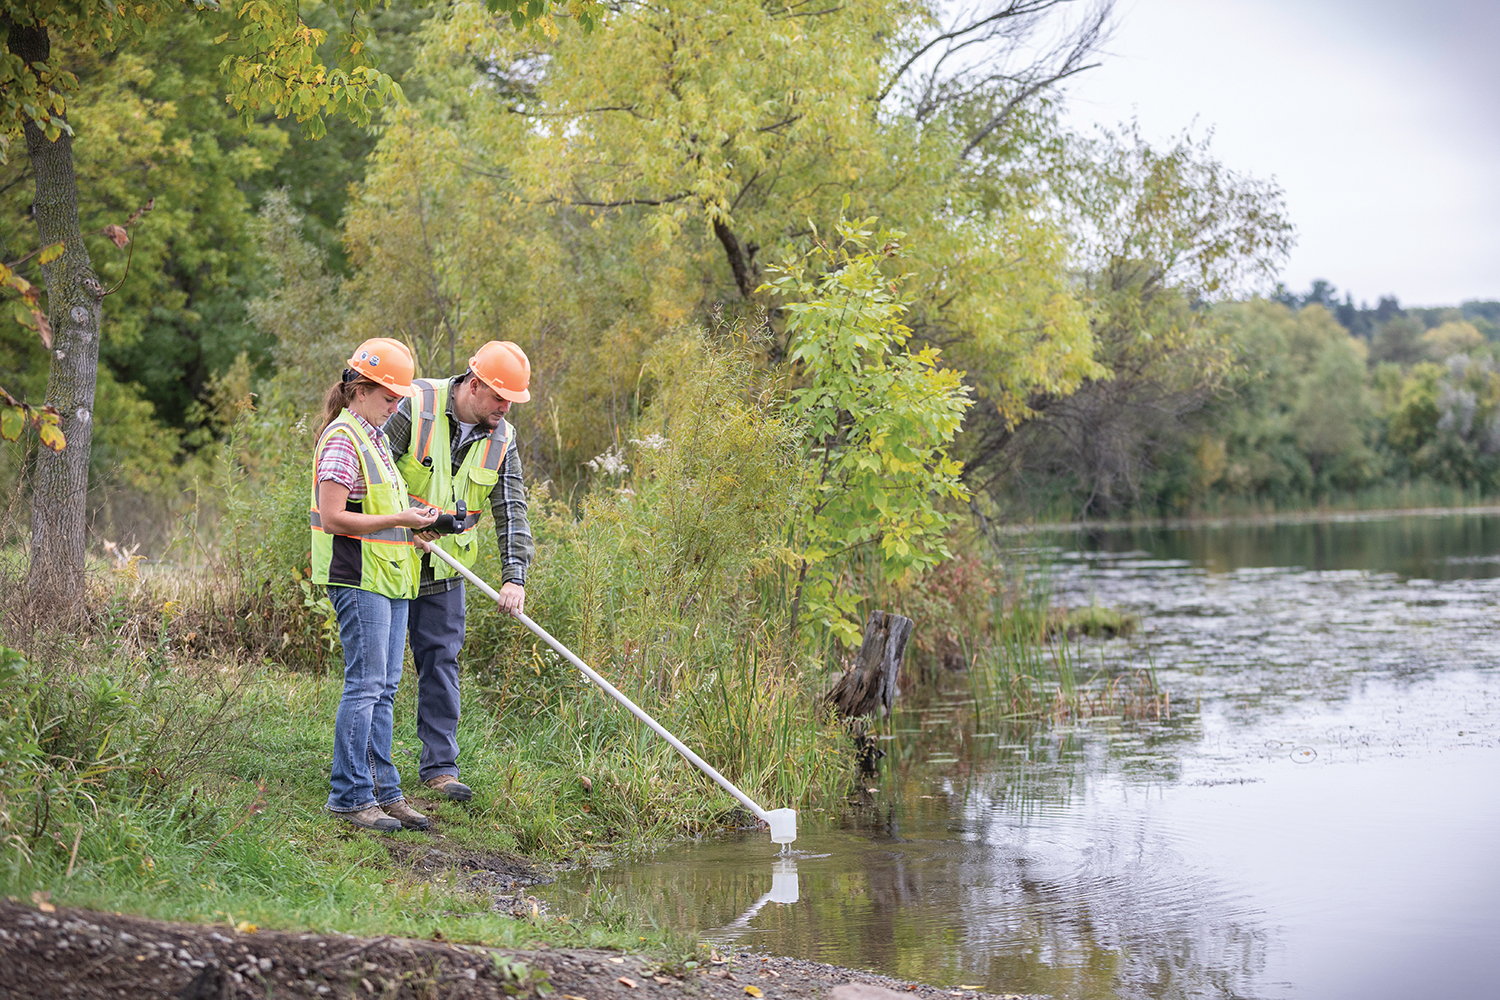
- Identify wetlands.
This should be one of the first steps taken during project planning. A desktop-level delineation can be completed anytime by a wetland professional and is used to determine the potential for wetlands on the project site.
Do not assume your site does not have wetlands.
Depending on the results of the review, an onsite wetland delineation may be needed, which can only be completed during specific times of the year (i.e. growing season). Missing this window can cause delays in your project or force you to make design assumptions based on inaccurate data, which can increase the risk for redesign once field data is available.
From the beginning of a delineation to having approved boundaries can take several weeks or months, so advanced planning is essential if the project development indicates a shorter construction timeline. Assigning a trained wetland delineator is important during this step to ensure project boundaries are accurately identified and reported to local reviewing agencies. Mismanagement at this stage can result in extra work and time delays. Once the boundary data is collected, project developers can update the design plan and determine if wetland impacts will occur.
- Examine potential impacts early.
Wetland impact approvals should always be obtained before you begin local project planning (i.e. plat approval) and identifying potential impacts early in design is key. This ensures that wetland regulation agencies are afforded the opportunity to review site plans and suggest ways to minimize impact and reduce the developer’s risk of costly design changes or permit denial.
- Contact local wetland regulation agencies.
If impacts are expected, it’s a good idea at this point to inform the local wetland regulation agencies and plan a pre-application meeting. There are several agencies that regulate wetlands and keeping all informed is vital to ensure the permitting process stays on track. The most common agencies that are involved include the Wetland Conservation Act (WCA) Local Government Unit (LGU), US Army Corps of Engineers (USACE), Department of Natural Resources (DNR), and in some areas of the state, Watershed Districts (WD) or Watershed Management Organizations (WMO). Learn more about these wetland regulation agencies.
The amount of impact proposed for a project can affect the length of the review process. The following approval timelines can be used as a guide:
|
Agency |
Permit Type | Days to Approval |
| WCA LGU | Wetland Impact Replacement Plan | 60 days |
| DNR | Public Waters Permit | 60 days |
| USACE* | Nationwide or General Permit (<0.5 acre) | 60 – 90 days |
| Letter of Permission (0.5 – 3 acres) | 4 – 9 months | |
| Individual Permit (> 3 acres) |
9 – 24 months |
*Permit thresholds reported are for non-transportation projects.
Approvals through Watershed Districts Management Organizations vary, so project developers should refer to local guidelines for application and review timelines.
Often, the reviews described above are independent of each other. Approvals from one agency (ie: WCA LGU) does not eliminate the need for approvals from other agencies (ie: DNR). While the agencies may communicate with each other, developers are ultimately responsible for ensuring permit applications are received by each individual agency.
Below is a general timeline of project tasks that should be completed prior to getting approval by local agencies.
| Task | Completion in Months (Prior to Local Plan Approval) |
| Wetland Delineation | 8 months prior |
| Delineation Approval | 6 months prior |
| Permit Pre-Application Meeting | 5 months prior |
| Permit Submittal* | 4 months prior |
| Permit Approval | 1 month prior |
* Assumes USACE General or Nationwide Permit.
Local ordinances should also be reviewed to ensure that all water resource-related requirements are being met. For example, some cities have wetland buffer setbacks that must be incorporated into the project design.
With proper planning, the wetland permitting process can be smooth and transparent. A little work in the beginning to identify the potential for wetlands can save the project manager from redesign and time delays that derail project progress.


 ob is a Principal at WSB with over 20-years of experience providing technical and management support to public and private clients. Bob’s special expertise in water resources management, infrastructure planning, project development, and land development make him an effective and trusted adviser on a variety of projects.


 Up until last month, real-time and ray tracing couldn’t be used in the same sentence without a bank of 10 GPUs and 2500 watts of power. Ray tracing makes renderings dynamic and realistic and thanks to powerful GPUs, shortens the amount of time spent on each frame. This recent advance in technology allows clients and the public to see reflections, higher quality shadows and experience the creation for themselves. Today, we’re utilizing these technologies to create stunning visualizations for our clients. Once the projects have been modeled, iterations are produced in minutes, instead of days or weeks.